SaaS CAC Payback Falls to 16 Months in 2025
The median SaaS CAC payback period fell to 16 months in 2025, down from 18 months in 2024, per a 342-company Aleph and Benchmarkit study. This report breaks down CAC payback, CAC ratio, LTV:CAC and acquisition cost by funding stage.
 Vikas Thakur Founder, RockingWeb 8 min read
On this page 12
- Key takeaways
- Answer Capsule
- Introduction
- The 16-Month CAC Payback Benchmark for 2025
- CAC Payback by Deal Size and Go-to-Market Motion
- What CAC Actually Costs by Funding Stage
- The New CAC Ratio: Spending $2 to Make $1
- Marketing Spend as a Percentage of Revenue
- LTV:CAC Ratios: Is 3:1 Still the Bar?
- Growth and Retention Context
- What This Means for Your SaaS Business
- Sources and References
Key takeaways
- Median SaaS CAC payback period fell to 16 months in 2025, down from 18 months in 2024 (Aleph and Benchmarkit, n=342)
- Top-quartile SaaS companies recover CAC in 6 months or less; bottom-quartile companies take 24 months or more
- Vertical SaaS payback runs 18 months versus 14 months for horizontal SaaS
- The median New CAC Ratio hit $2.00 in 2024, up 14% year-on-year, meaning $2 of spend for every $1 of new ARR
- Bootstrapped and self-serve SaaS companies acquire customers for $200 to $600; enterprise sales-led companies spend $2,500 to $6,000
- Median LTV:CAC for private B2B SaaS sits at 3.3:1, well below the 5:1 top-quartile mark
- Private SaaS companies now spend a median 8% of revenue on marketing, down from 10% two years earlier
- Median ARR growth is projected to accelerate from 15% in 2024 to 20% in 2025 (KeyBanc and Sapphire Ventures)
Answer Capsule
The median SaaS CAC payback period fell to 16 months in 2025, down from 18 months in 2024. Aleph and Benchmarkit surveyed 342 B2B SaaS and AI-native companies for full-year 2025 actuals. A separate 2026 SaaS Rise synthesis of 2,500 companies puts the median closer to 15 months, mostly on US and global data.
Introduction
Sixteen months.
That’s how long the median SaaS company now takes to recover what it spent acquiring one customer.
A fresh study of 342 B2B SaaS and AI-native companies puts the 2025 median CAC payback period at 16 months, down from 18 months in 2024.
That’s real progress, but the average hides a brutal split.
Top-quartile companies recover their CAC in 6 months or less.
Bottom-quartile companies wait 24 months or longer, more than a full sales cycle behind.
If you don’t know which group your business sits in, the numbers below will tell you fast.
This report pulls together the newest CAC payback, CAC ratio and acquisition-cost benchmarks from Aleph, Benchmarkit, KeyBanc, Sapphire Ventures and SaaS Rise.
The 16-Month CAC Payback Benchmark for 2025
CAC payback measures how many months of gross margin it takes to earn back what you spent to land a customer. It’s the single clearest signal of whether your growth engine actually works.
Aleph and Benchmarkit’s 2026 SaaS and AI Performance Benchmarks report surveyed 342 B2B SaaS and AI-native companies, with 198 of them reporting CAC payback specifically, covering full-year 2025 actuals. The median landed at 16 months, down from 18 months the year before.
SaaS Rise’s 2026 SaaS Benchmarks Report, which pools data from 2,500 SaaS companies across more than 15 industry surveys including SaaS Capital and KeyBanc, puts the figure at 15 months, up from 13 months in 2021. Both studies draw mostly on US and global private SaaS data.
| Percentile | Months to Recover CAC |
|---|---|
| Top quartile | 6 or fewer |
| Median (2025) | 16 |
| Median (2024) | 18 |
| Bottom quartile | 24 or more |
Six months separates the top quartile from the median. Eighteen months separates the top quartile from the bottom. That gap is the difference between a company that can reinvest cash into growth and one that’s still waiting to find out if a customer cohort was worth acquiring.
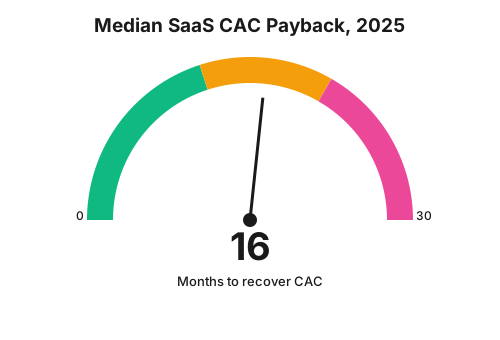
Sixteen months is the number to beat. Anything under 12 puts you in genuinely efficient territory.
CAC Payback by Deal Size and Go-to-Market Motion
The median hides more than it reveals. Payback varies hugely by deal size and by whether you sell horizontal or vertical software.
Aleph and Benchmarkit’s breakdown shows smaller deals recover faster, and horizontal products outrun vertical ones:
| Segment | Median CAC Payback |
|---|---|
| Sub-$5K ACV | 11 months |
| Horizontal SaaS | 14 months |
| Vertical SaaS | 18 months |
| $50K to $100K ACV (enterprise) | 22 months |
Vertical SaaS takes 4 months longer than horizontal SaaS to break even on acquisition spend, largely because vertical deals close slower and lean harder on high-touch sales. Enterprise ACV deals ($50K to $100K) take almost twice as long as sub-$5K, self-serve style deals.
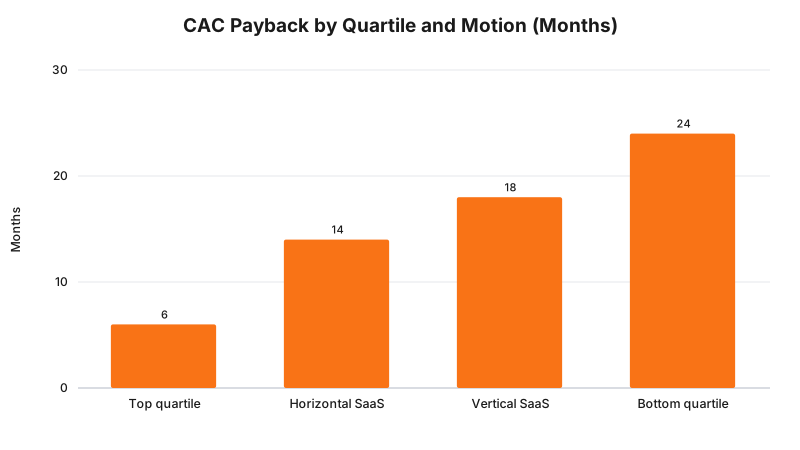
If you sell vertical software on long sales cycles, don’t benchmark yourself against a horizontal, self-serve product. Compare like with like, or the number will scare you for no good reason.
What CAC Actually Costs by Funding Stage
Dollar figures matter as much as the payback period. A $2,500 CAC on a $200 monthly plan is a very different problem to a $2,500 CAC on a $50,000 annual contract.
SaaS Rise’s 2026 synthesis, citing SaaS Capital, KeyBanc, Varos, Bridge Group and ChartMogul data, breaks CAC down by funding stage and go-to-market motion:
| Stage | CAC Range | LTV:CAC (median) |
|---|---|---|
| Bootstrapped / self-serve | $200 to $600 | 5.0:1 |
| Series A | $800 to $1,500 | 3.5:1 |
| Enterprise sales-led | $2,500 to $6,000 | 3.0:1 |
For context, HubSpot’s 2024 State of Marketing data puts the blended B2B SaaS average CAC at $702, with efficient companies sitting in the $200 to $400 range and struggling ones running $1,000 to $3,000 or higher.
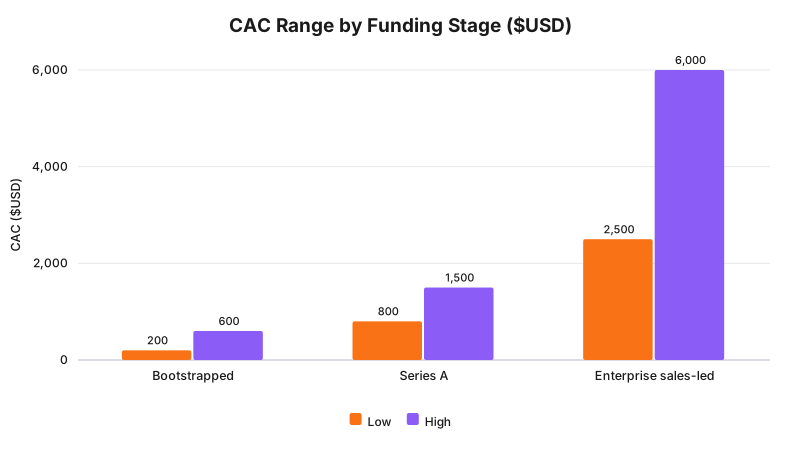
The lower your CAC, the higher your LTV:CAC tends to run, which is exactly what you’d expect. Bootstrapped, self-serve companies get more efficient per dollar than sales-led ones, because there’s no rep salary sitting inside the acquisition cost.
The New CAC Ratio: Spending $2 to Make $1
CAC payback tells you the time cost. The New CAC Ratio tells you the dollar cost: how much sales and marketing spend it takes to generate $1 of new ARR.
Benchmarkit’s 2025 SaaS Performance Metrics report puts the median New CAC Ratio at $2.00, up 14% year-on-year. The bottom quartile runs at $2.82. Blended CAC ratio (new plus expansion revenue) sits lower, at roughly $1.81, down 12% year-on-year as expansion revenue does more of the work.
| Metric | 2024 Value | Year-on-Year Change |
|---|---|---|
| New CAC Ratio (median) | $2.00 | up 14% |
| New CAC Ratio (bottom quartile) | $2.82 | not stated |
| Blended CAC Ratio (median) | $1.81 | down 12% |
| Expansion CAC Ratio (median) | $1.00 | not stated |
A $2.00 New CAC Ratio means you’re spending $2 in sales and marketing for every $1 of new annual recurring revenue you book. That only works if retention is strong enough to earn the rest back over the customer’s lifetime.
Expansion CAC Ratio, at a median of $1.00, is the cheapest dollar you’ll ever spend. Upselling an existing customer costs half of what winning a new one does.
Marketing Spend as a Percentage of Revenue
How much of revenue should go into marketing? SaaS Rise’s 2026 synthesis, citing SaaS Capital, KeyBanc and Varos data, puts the median at 8% of revenue for private B2B SaaS companies, down from 10% two years earlier.
| Segment | Marketing Spend (% of Revenue) |
|---|---|
| Bootstrapped SaaS | around 5% |
| Equity-backed SaaS | around 13% |
| All private B2B SaaS (median) | 8% |
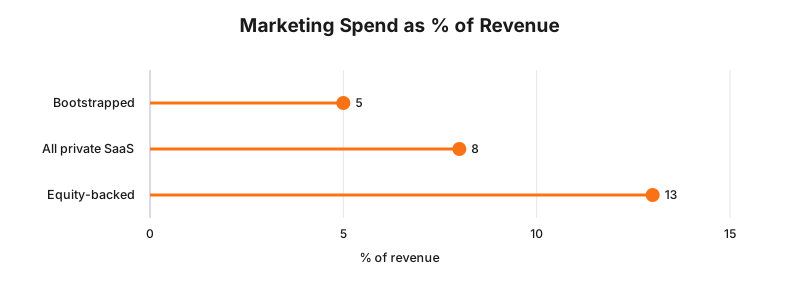
Equity-backed companies spend more than double the share of revenue that bootstrapped companies do. That’s the price of chasing faster growth with someone else’s capital.
LTV:CAC Ratios: Is 3:1 Still the Bar?
The old rule of thumb was a 3:1 LTV:CAC ratio. SaaS Rise’s 2026 data shows that ratio holding as a floor, not a target: the median across private SaaS now sits at 3.3:1.
| Segment | LTV:CAC (median) | Top Quartile |
|---|---|---|
| All private SaaS | 3.3:1 | 5.0:1 |
| Bootstrapped / self-serve | 5.0:1 | 8.0:1 |
| Series A | 3.5:1 | 5.0:1 |
| Enterprise sales-led | 3.0:1 | 5.0:1 |
Top-quartile bootstrapped companies hit 8.0:1, close to triple the enterprise sales-led median. If your LTV:CAC sits right at 3:1, you’re at the floor of what’s sustainable, not comfortably ahead of it.
Growth and Retention Context
CAC numbers only mean something next to growth and retention. KeyBanc Capital Markets and Sapphire Ventures’ 16th annual Private SaaS Company Survey, released in November 2025, projects median ARR growth accelerating from 15% in 2024 to 20% in 2025, alongside gross retention holding near 90% and net retention staying above 100%.
| Metric | 2024 | 2025 (projected) |
|---|---|---|
| Median ARR growth | 15% | 20% |
| Gross retention | around 90% | around 90% |
| Net retention | above 100% | above 100% |
| AE payback period | not stated | 18 months by 2026 |
That same survey projects account executive payback periods shortening to 18 months by 2026, a separate but related metric to the CAC payback figures above; it measures how long it takes a sales rep’s own bookings to cover their fully loaded cost, not blended company-wide CAC.
If your CAC payback is improving but your net retention is under 100%, don’t celebrate yet. A shorter payback on leaky revenue is still a leaky bucket.
What This Means for Your SaaS Business
If your CAC payback sits above 20 months and you’re not enterprise sales-led, that’s worth investigating before you pour more budget into the same channels. Compare yourself against your own motion and ACV band first: a vertical, high-touch product should expect 18 months, not the 14-month horizontal median.
Building product-led onboarding, self-serve upgrade paths and lighter-touch sales motions is one of the more reliable ways to pull CAC payback down, because it strips sales headcount cost out of the acquisition equation entirely. That’s exactly the kind of work RockingWeb does for founders building or rebuilding their SaaS product.
If you’re trying to work out where your own CAC payback and LTV:CAC actually sit, book a consultation or look at our SaaS development services, where we help founders build faster, leaner products that shorten the path to payback. You can also run your own numbers through our SaaS valuation calculator to see how CAC efficiency feeds into what your business is worth.
For the wider metrics picture beyond acquisition costs, our SaaS metrics benchmark report covers NRR, Rule of 40, burn multiples and 47 other KPIs across 2,000-plus companies. Our micro-SaaS revenue analysis is the better comparison if you’re running a smaller, founder-led product rather than a funded, sales-led one.
Sources and References
- Aleph and Benchmarkit, 2026 SaaS and AI Performance Benchmarks, published June 2026, n=342 companies (198 reporting CAC payback), full-year 2025 actuals
- Benchmarkit, 2025 SaaS Performance Metrics, CAC ratio and payback data
- SaaS Rise, 2026 SaaS Benchmarks Report, published June 2026, synthesis of 2,500 companies across 15-plus surveys including SaaS Capital, KeyBanc, Varos, Bridge Group and ChartMogul
- KeyBanc Capital Markets and Sapphire Ventures, 16th Annual Private SaaS Company Survey, released November 2025
- Your Growth Partner, CAC Benchmarks by Industry, citing HubSpot’s 2024 State of Marketing report for the $702 blended B2B SaaS average CAC figure
Note: these are US and global SaaS benchmark studies. No Australia-specific SaaS CAC payback dataset of comparable scale currently exists, so treat the figures above as international context rather than a local Australian benchmark.
Vikas Thakur
Founder of RockingWeb. 16 years of experience from working at TPG, iiNet and Monadelphous, now building websites, software and digital marketing for local businesses in Rockingham and Perth.