44% vs 25%: Usage-Based SaaS Pricing Wins in 2025
SaaS companies using usage-based pricing grew at a median 44% in 2024, 76% faster than the 25% posted by subscription-only companies, per Pavilion and Benchmarkit's 583-company survey. This report breaks down growth, retention and adoption by pricing model.
 Vikas Thakur Founder, RockingWeb 8 min read
On this page 10
- Key takeaways
- Answer Capsule
- Introduction
- The 44% Growth Gap: Usage-Based vs Subscription Pricing
- Why Usage-Based Pricing Also Wins on Retention
- Usage-Based Pricing Adoption in 2025
- The Trade-Off: Forecasting Gets Harder
- SaaS Growth and Efficiency Context for 2025
- What This Means for Your SaaS Pricing Strategy
- Sources and References
Key takeaways
- SaaS companies using usage-based pricing grew at a median 44% in 2024, compared with 25% for subscription-only companies (Pavilion and Benchmarkit, n=149)
- Hybrid subscription-plus-usage pricing delivered the strongest net revenue retention, at 110% median, versus 101% for pure subscription and pure usage-based models (n=228)
- Usage-based pricing posted the highest gross revenue retention of any model, at 92% median, ahead of 88% for both subscription and hybrid pricing (n=225)
- Only 7.5% of the 563 SaaS companies surveyed run pure usage-based pricing as their primary model; 61.2% still charge pure subscription and 24.5% run a hybrid model
- 85% of 100 SaaS companies surveyed separately by Metronome and Greyhound Capital in January 2025 had adopted some form of usage-based pricing
- Median SaaS growth rate overall fell to 26% in 2024, down from 27% in 2023 and 30% in 2022 (n=149)
- The New Customer CAC Ratio climbed to $2.00 in 2024, up 14% year on year, meaning $2 of sales and marketing spend for every $1 of new ARR (n=73)
- Companies planned a median 35% growth rate for 2025, nine points above the 26% they delivered in 2024 (n=71)
Answer Capsule
SaaS companies using usage-based pricing grew at a median 44% in 2024, 76% faster than the 25% posted by subscription-only companies. Pavilion and Benchmarkit surveyed 583 B2B SaaS companies for their May 2025 benchmarks report, with 149 reporting growth rate by pricing model. Usage-based pricing also produced the highest gross revenue retention, at 92% median.
Introduction
Forty-four percent.
That’s the median growth rate SaaS companies posted in 2024 when they priced primarily on usage instead of a flat subscription.
Subscription-only companies grew at 25% over the same period, according to Pavilion and Benchmarkit’s May 2025 survey of 583 B2B SaaS companies.
That’s a 19-point growth gap between two pricing models competing in the same market.
The retention numbers back it up: usage-based pricing posted the best gross revenue retention of any model in the survey, at 92% median.
Yet only 7.5% of the companies surveyed run pure usage-based pricing as their primary model.
Most SaaS founders are still defaulting to the slower-growing option.
This report breaks down growth, retention and adoption by pricing model, so you can see exactly where usage-based pricing helps, and where the data gets more complicated.
The 44% Growth Gap: Usage-Based vs Subscription Pricing
Pavilion and Benchmarkit’s 2025 B2B SaaS Performance Metrics Benchmarks report, published May 2025, surveyed 583 B2B SaaS companies across 12 syndication partners including Maxio, Sage and Mosaic. Of those, 149 reported 2024 growth rate broken down by primary pricing model, a first for this annual benchmark series.
The result is the clearest head-to-head comparison available: companies primarily using usage-based pricing grew at a median 44% in 2024. Subscription-only companies grew at 25%. Hybrid subscription-plus-usage companies sat in between, at 26%.
| Pricing Model | Median Growth Rate (2024) | 25th Percentile | 75th Percentile |
|---|---|---|---|
| Usage-Based Pricing | 44% | 31% | 80% |
| Subscription + Usage (Hybrid) | 26% | 17% | 42% |
| Subscription | 25% | 10% | 50% |
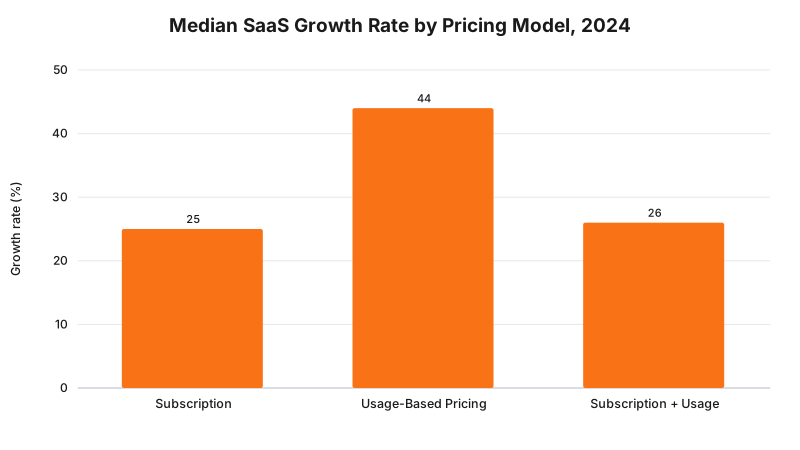
Benchmarkit flags one honest caveat: usage-based pricing is more common among AI-native and younger companies, which naturally skews growth rates higher regardless of pricing model. Even so, a 19-point gap at the median, and an 80% growth rate at the 75th percentile, is too wide to write off as noise.
Takeaway: if your SaaS company charges a flat subscription and your growth rate sits near the 25% median, pricing model is worth investigating before you touch your marketing spend.
Why Usage-Based Pricing Also Wins on Retention
Growth means nothing if customers leave as fast as they arrive. Benchmarkit calculated retention by pricing model for the first time in this year’s report, using two separate metrics: Gross Revenue Retention (GRR), which excludes expansion revenue, and Net Revenue Retention (NRR), which includes it.
Usage-based pricing won outright on GRR. Hybrid pricing won outright on NRR.
| Pricing Model | Gross Revenue Retention (Median) | Net Revenue Retention (Median) |
|---|---|---|
| Subscription | 88% | 101% |
| Usage-Based Pricing | 92% | 101% |
| Subscription + Usage (Hybrid) | 88% | 110% |
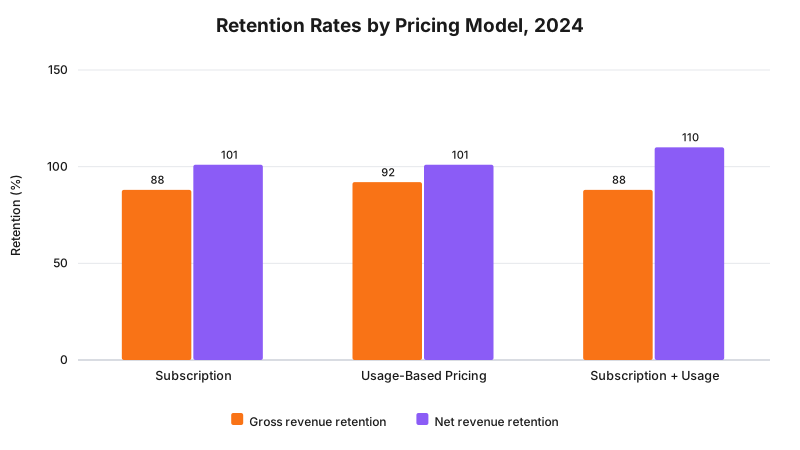
GRR (n=225) measures how much existing customer revenue survives churn and downgrades, with no credit for upsells. Usage-based pricing’s 92% median beats both other models by 4 points, likely because usage naturally scales down with a struggling customer instead of triggering an outright cancellation.
NRR (n=228) tells a different story. Hybrid pricing hit 110% median, a full 9 points ahead of pure subscription or pure usage-based pricing, both at 101%. A subscription floor plus a usage overage gives sales and customer success teams two separate expansion levers: seat growth and consumption growth. Pure usage-based pricing has only one.
Takeaway: usage-based pricing keeps existing revenue from leaking out. Hybrid pricing is what grows that revenue once it’s in the door.
Usage-Based Pricing Adoption in 2025
Despite the growth and retention numbers, usage-based pricing is still a minority choice. Of the 563 companies in Benchmarkit’s participant pool who reported a primary pricing model, 61.2% still run pure subscription pricing.
| Pricing Model | Share of 563 SaaS Companies Surveyed |
|---|---|
| Subscription | 61.2% |
| Subscription + Usage | 24.5% |
| Usage-Based | 7.5% |
| Subscription + Outcome | 3.8% |
| Outcome-Based | 2.9% |
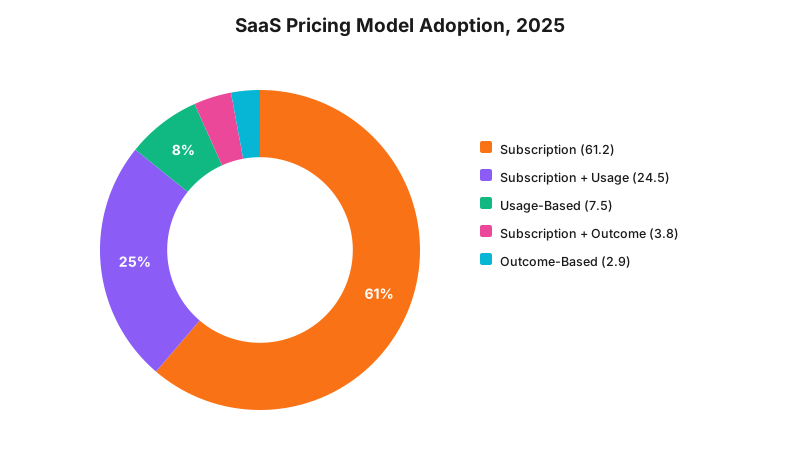
A separate January 2025 survey from Metronome and Greyhound Capital reports a much higher adoption figure: 85% of the 100 SaaS companies they surveyed had adopted some form of usage-based pricing. That number is not directly comparable to Benchmarkit’s 7.5% and 24.5%. Metronome’s sample was drawn from customers of its own usage-based billing platform, which skews heavily toward companies already committed to consumption pricing, and its 85% figure counts any usage component at all, not just companies where usage is the primary model. Treat the Benchmarkit adoption split as the more representative baseline, and the Metronome figure as a signal of where the leading edge of the market is heading.
Takeaway: roughly one in three SaaS companies now has some usage component in their pricing, but pure usage-based pricing as the primary model is still rare.
The Trade-Off: Forecasting Gets Harder
Usage-based pricing does not come free. Variable revenue is harder to forecast than a fixed subscription, and that shows up in how companies operate once they adopt it.
Maxio’s 2025 SaaS Pricing Trends Report, drawing on Benchmarkit survey data, found that 73% of SaaS companies with usage-based pricing are actively building dedicated processes to forecast variable revenue, something a subscription-only finance team rarely needs to do. Metronome and Greyhound Capital’s survey identified the three biggest implementation obstacles as real-time usage monitoring, billing system complexity and getting the pricing metric itself right.
None of that is a reason to avoid usage-based pricing. It’s a reason to budget for the billing and finance tooling before you launch it, not after.
Takeaway: the growth and retention upside is real, but it comes with a forecasting and billing-infrastructure cost that a pure subscription model does not have.
SaaS Growth and Efficiency Context for 2025
Pricing model sits inside a wider slowdown. Benchmarkit’s overall median growth rate, across all pricing models, fell to 26% in 2024, down from 27% in 2023 and 30% in 2022. The 75th percentile fell even further, from 60% in 2023 to 50% in 2024.
| Metric | 2022 | 2023 | 2024 |
|---|---|---|---|
| Median SaaS growth rate (n=149) | 30% | 27% | 26% |
| Median New Customer CAC Ratio (n=73) | $1.75 | $1.76 | $2.00 |
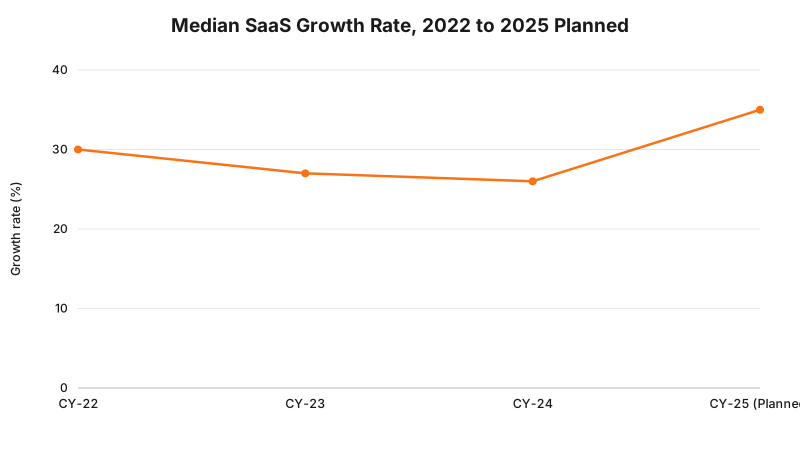
Acquisition costs moved the wrong way at the same time. The median New Customer CAC Ratio, which measures sales and marketing dollars spent per dollar of new ARR, rose 14% in 2024 to $2.00. Companies are spending more to grow slower, which makes the 44% versus 25% growth gap between pricing models even harder to ignore. Companies surveyed also planned a median 35% growth rate for 2025, nine points above what they delivered in 2024, a gap Benchmarkit’s own analysts flagged as optimistic given the trend.
Takeaway: in a market where median growth is shrinking and acquisition costs are rising, pricing model is one of the few growth levers still showing a clear, measurable upside.
What This Means for Your SaaS Pricing Strategy
The data points to a specific strategy, not a blanket rule. Pure usage-based pricing wins on top-line growth and on keeping existing revenue from churning out. Hybrid subscription-plus-usage pricing wins on expanding that revenue once a customer is in. Pure subscription pricing, still run by 61.2% of the market, is the slowest grower on every metric in this report.
If you’re building or rebuilding a SaaS product’s pricing and billing architecture, the model you choose has to be built into the product from the start, not bolted on once sales asks for it. That’s the kind of work RockingWeb does for SaaS founders: pricing-aware product architecture, metered billing integrations and the customer-facing usage dashboards that make consumption pricing legible to the people paying for it.
If you want to work out which pricing model fits your product and where your own growth and retention numbers sit against these benchmarks, get in touch or look at our SaaS development services. Our SaaS metrics benchmark report covers the wider NRR, Rule of 40 and CAC picture beyond pricing model, and our SaaS valuation calculator shows how growth rate and retention feed into what your business is worth.
Sources and References
- Pavilion and Benchmarkit, 2025 B2B SaaS Performance Metrics Benchmarks, published May 2025, n=583 total participants (individual metrics range from n=101 to n=228 depending on response rate; growth rate by pricing model is n=149)
- Metronome and Greyhound Capital, State of Usage-Based Pricing 2025, published January 2025, n=100 SaaS companies across application, vertical and infrastructure categories
- Maxio, 2025 SaaS Pricing Trends Report, drawing on Benchmarkit survey data
Note: the Benchmarkit growth-rate and retention breakdowns by pricing model are US and global B2B SaaS benchmarks. No Australia-specific dataset of comparable scale currently exists for pricing model versus growth rate, so treat these figures as international context rather than a local Australian benchmark.
Vikas Thakur
Founder of RockingWeb. 16 years of experience from working at TPG, iiNet and Monadelphous, now building websites, software and digital marketing for local businesses in Rockingham and Perth.