77% SaaS Gross Margin Benchmarks Revealed for 2025
The median SaaS company runs a 77% gross margin on total revenue in 2025, per Benchmarkit's SaaS Performance Metrics report. This breakdown covers subscription versus services margin, cost of goods sold, and where the rest of every ARR dollar goes.
 Vikas Thakur Founder, RockingWeb 8 min read

On this page 9
- Key takeaways
- Answer Capsule
- Introduction
- The 77% Median Gross Margin Benchmark for 2025
- Why Subscription and Services Margins Split So Far Apart
- A Second Study Puts Margin Near 83%: What SaaS Capital Found
- Where the Other 83 Cents Go: Department Spending as a Share of ARR
- What This Means for Your SaaS Business
- Sources and References
Key takeaways
- Median SaaS gross margin sits at 77% for total revenue, according to Benchmarkit’s 2025 SaaS Performance Metrics report
- Subscription revenue alone carries an 81% median gross margin, 4 points above the blended total
- Professional services revenue drags the blended number down hard, at just 30% median gross margin
- Professional services makes up roughly 15% of total revenue at the median SaaS company
- SaaS Capital’s 2026 Spending Benchmarks study (1,000+ private B2B SaaS firms, surveyed March 2026) puts total cost of goods sold at 17% of ARR, implying a margin near 83%
- Hosting costs eat 5% of ARR at the median company, unchanged year on year
- R&D is the single biggest cost line behind gross margin, at 22% of ARR
- Sales (15% of ARR) and G&A (15% of ARR) tie for second place, ahead of customer support and success at 9%
Answer Capsule
The median SaaS company posts a 77% gross margin on total revenue, per Benchmarkit’s 2025 SaaS Performance Metrics report of US and global private companies. SaaS Capital’s March 2026 survey of 1,000+ private SaaS firms puts total COGS at 17% of ARR, implying a similar 83% margin. Subscription revenue alone runs higher, at 81% gross margin, while professional services revenue drags the blended number down to 30%.
Introduction
Seventy-seven percent.
That’s the median gross margin for a SaaS company today, according to Benchmarkit’s 2025 SaaS Performance Metrics report.
Sounds solid, until you split the number apart.
Subscription revenue alone carries an 81% margin. Professional services revenue drags the blended figure down to just 30%, and services still make up roughly 15% of total revenue at the median company.
A second, larger study lands in the same neighbourhood: SaaS Capital’s 2026 survey of over 1,000 private B2B SaaS firms puts total cost of goods sold at 17% of ARR, which works out to an 83% margin.
If your gross margin sits well under 77%, something in your cost structure, hosting, DevOps, or a bloated services arm, is eating cash you could put toward growth.
This report breaks down where SaaS gross margin sits in 2025 and 2026, what pulls it down, and where the rest of every ARR dollar actually goes once cost of goods sold is paid.
The 77% Median Gross Margin Benchmark for 2025
Gross margin is what’s left of revenue after you strip out the direct cost of delivering the product: hosting, infrastructure, DevOps, support that’s tied directly to service delivery, and any professional services cost of sale. It’s the number that decides how much cash is left to fund sales, marketing, R&D, and profit.
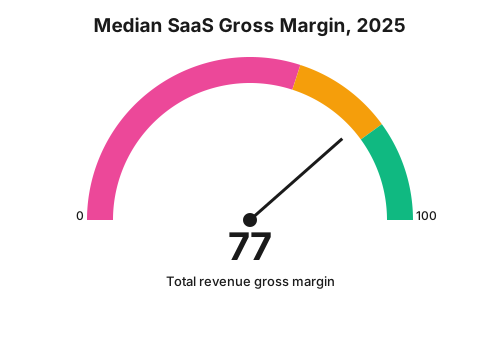
Benchmarkit’s 2025 SaaS Performance Metrics report puts median gross margin at 77% across total revenue. Split by revenue type, subscription revenue runs meaningfully higher than the blended number, while professional services revenue runs far lower.
| Revenue Type | Median Gross Margin |
|---|---|
| Total revenue (blended) | 77% |
| Subscription revenue | 81% |
| Professional services revenue | 30% |
Seventy-seven percent is the number to compare yourself against. A pure subscription business without a services arm should expect to sit closer to 81%, not 77%.
Takeaway: median SaaS gross margin runs 77% blended, but the real benchmark depends on how much of your revenue comes from services rather than subscriptions.
Why Subscription and Services Margins Split So Far Apart
An 81% versus 30% gap is not a rounding difference. It’s the difference between a business model that scales cheaply and one that scales by adding headcount.
Subscription revenue costs little to deliver once the product exists: hosting, a support team, and infrastructure spend that grows slower than revenue. Professional services revenue, implementation, custom integration, managed onboarding, costs almost as much to deliver as it earns, because it’s billed largely as people’s time.
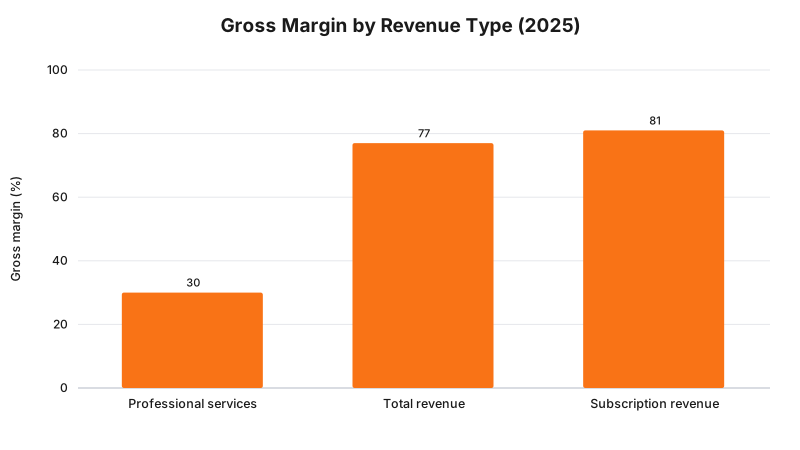
Benchmarkit’s report notes that professional services revenue represents around 15% of total revenue at the median company. A company that leans harder into services, above 15% to 20% of revenue, should expect its blended gross margin to sit below the 77% median, even if its core subscription product is healthy.
Takeaway: a 51-point gap separates subscription margin from services margin, so your revenue mix matters as much as your pricing when it comes to blended gross margin.
A Second Study Puts Margin Near 83%: What SaaS Capital Found
Benchmarkit isn’t the only source. SaaS Capital’s 15th annual Spending Benchmarks report, drawn from a March 2026 survey of over 1,000 private B2B SaaS companies, approaches the same question from the cost side rather than the margin side.
Instead of reporting gross margin directly, SaaS Capital reports total cost of goods sold as a percentage of ARR, broken into four buckets:
| COGS Category | Median % of ARR |
|---|---|
| Hosting | 5% |
| DevOps | 4% |
| Professional services delivery | 5% |
| Other COGS | 3% |
| Total COGS | 17% |
Seventeen percent of ARR spent on cost of goods sold implies a gross margin of roughly 83%, a few points above Benchmarkit’s 77% figure. The two studies use different methodologies and different company samples, so treat them as two independent data points landing in the same high-70s-to-low-80s range, not as a single confirmed number.
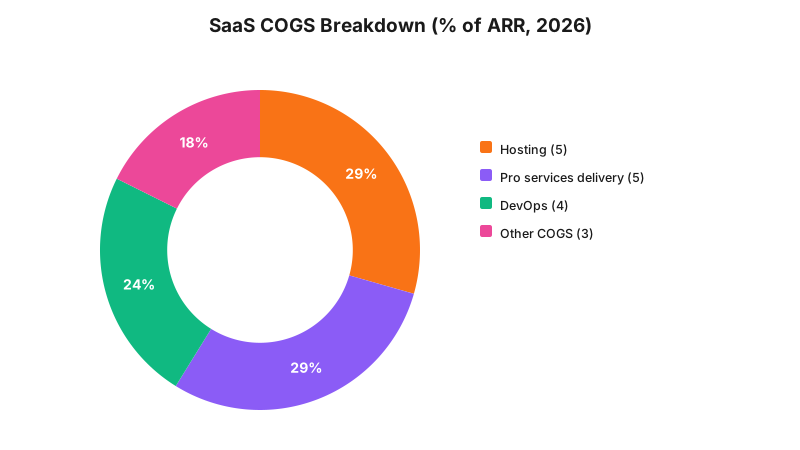
Hosting spend held flat year on year at 5% of ARR, according to SaaS Capital’s data, so the industry isn’t seeing meaningful relief from falling cloud infrastructure costs, at least not yet.
Takeaway: two separate, differently built studies both land SaaS gross margin somewhere between 77% and 83%, so treat 80% as a rough midpoint rather than a hard target.
Where the Other 83 Cents Go: Department Spending as a Share of ARR
Gross margin only tells half the story. What happens to that margin once it’s earned matters just as much for whether a SaaS company is actually healthy.
SaaS Capital’s 2026 survey also breaks out department spending as a percentage of ARR, covering the categories that sit below the gross margin line:
| Department | Median % of ARR |
|---|---|
| R&D | 22% |
| Sales | 15% |
| G&A | 15% |
| Marketing | 8% |
| Customer support and success | 9% |
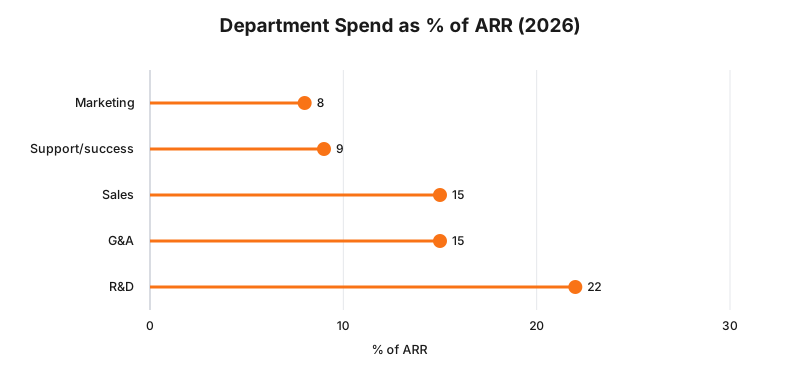
R&D alone consumes almost a third of the gross margin a median company earns. Add sales and G&A, and roughly half of ARR is committed before marketing or profit get a look in. Bootstrapped companies spend a median 96% of ARR across all these categories combined; equity-backed companies spend closer to 101%, according to the same SaaS Capital survey, which is one reason so many venture-backed SaaS businesses run at a loss even with healthy gross margins.
Takeaway: a 77% to 83% gross margin doesn’t guarantee profitability. R&D, sales, and G&A together typically claim more than half of every ARR dollar before a company reaches breakeven.
What This Means for Your SaaS Business
If your gross margin sits meaningfully below 77%, start with the revenue mix question before you start cutting infrastructure costs. A services-heavy revenue base pulls the blended number down even when your core subscription product is priced and built correctly. Compare your subscription-only margin against the 81% benchmark, not the 77% blended figure, to see whether the product itself is the problem.
If subscription margin is also weak, hosting and DevOps costs are the next place to look. At 5% and 4% of ARR respectively, per SaaS Capital’s data, those two categories alone should not be pushing your COGS past the 17% median unless your architecture is inefficient or your infrastructure spend has outgrown your customer base.
Product architecture decisions made early, multi-tenancy, caching, how aggressively a codebase avoids per-customer infrastructure, tend to show up directly in hosting and DevOps costs years later. That’s the kind of build decision RockingWeb works through with founders building or rebuilding a SaaS product, because a margin problem baked into the architecture is far more expensive to fix after launch than before it.
If you want a second set of eyes on where your own cost of goods sold sits against these figures, book a consultation or look at our SaaS development services, where we help founders build products with lower delivery costs from day one. You can also run your numbers through our SaaS valuation calculator to see how gross margin feeds into what a SaaS business is worth.
For the wider metrics picture beyond gross margin, our SaaS metrics benchmark report covers NRR, Rule of 40, burn multiples and 47 other KPIs. If you’re running a smaller, founder-led product rather than a funded, sales-led one, our micro-SaaS revenue analysis and SaaS CAC payback benchmarks are the closer comparisons.
Sources and References
- Benchmarkit, 2025 SaaS Performance Metrics report, median gross margin by total revenue, subscription revenue, and professional services revenue
- SaaS Capital, 2026 Spending Benchmarks for Private B2B SaaS Companies, 15th annual survey, conducted March 2026, n=1,000+ private B2B SaaS companies
Note: both studies survey US and global private SaaS companies. No Australia-specific SaaS gross margin dataset of comparable scale currently exists, so treat the figures above as international context rather than a local Australian benchmark.
Vikas Thakur
Founder of RockingWeb. 16 years of experience from working at TPG, iiNet and Monadelphous, now building websites, software and digital marketing for local businesses in Rockingham and Perth.