32.9%: Involuntary Churn Statistics for SaaS (2026)
Involuntary churn accounts for 32.9% of all SaaS churn, according to Recurly Research's July 2026 benchmark data. Here is how that figure breaks down by industry, customer size, and business model, and what recovering it is actually worth.
 Vikas Thakur Founder, RockingWeb 7 min read
On this page 8
- Key takeaways
- Involuntary Churn Is 32.9% of All SaaS Churn
- Involuntary Churn by Industry, 2026
- Involuntary Churn Falls as Customers Get Bigger
- B2B SaaS vs DTC: Why Business Model Changes the Number
- What Failed Payments Actually Cost You, and What Recovers It
- What To Do If Involuntary Churn Sits Above Benchmark
- Where To Go From Here
Key takeaways
- Involuntary churn accounts for 32.9% of all SaaS churn (1.06 of 3.22 percentage points), according to Recurly Research’s July 2026 benchmark data.
- Digital media and entertainment has the highest involuntary share of any industry Recurly tracks, at 38.4% of total churn, against 32.9% for SaaS.
- Involuntary churn’s share of total churn drops sharply as customers get bigger: 30.3% at the $10 to $25 ARPC tier, versus 5.9% at $250 and above.
- Wider subscription-industry estimates from Paddle research, cited by Baremetrics, put involuntary churn as high as 40% of total churn.
- Failed payments cost the average subscription business 9% of monthly recurring revenue, according to Baremetrics’ analysis of its own customer base.
- B2B SaaS typically runs a 2% to 5% involuntary churn rate, well below the 8% to 15% typical for direct-to-consumer subscription boxes.
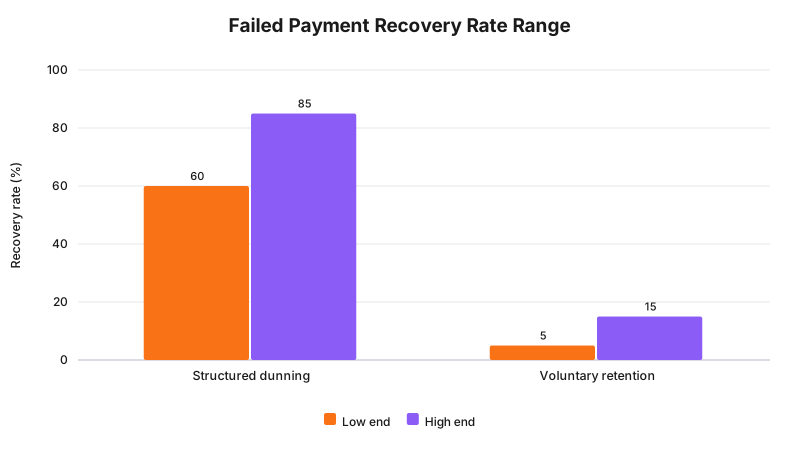
- Structured dunning recovers 60% to 85% of failed payments, against 5% to 15% for voluntary-churn retention efforts, per Baremetrics.
- 148 Baremetrics Recover customers recovered $1.35 million in a single month (December 2024), a median 410% return on their subscription cost.
Quick Answer
Involuntary churn made up 32.9% of all SaaS churn in Recurly Research’s July 2026 benchmark data. That is 1.06 of 3.22 percentage points lost to failed payments, not customers choosing to leave. Wider industry estimates from Paddle research, cited by Baremetrics, put the share as high as 40%.
Involuntary Churn Is 32.9% of All SaaS Churn
Recurly Research’s July 2026 benchmark data puts a number on something most SaaS founders feel but rarely measure. Of every dollar of churn a SaaS company logs, 32.9% never involved a customer deciding to leave. A card expired. A bank flagged a charge. A payment retry never fired. That is roughly one churned customer in three you never actually lost, and never tried to win back. Some estimates put the real number even higher: Paddle research, cited by Baremetrics, puts involuntary churn at 20% to 40% of total churn across subscription businesses generally. Either way, a meaningful slice of what shows up in your churn report is a billing problem wearing a churn costume.
Voluntary churn is a customer who cancels on purpose, unhappy with the product, the price, or a competitor’s offer. Involuntary churn is different. It is entirely a billing and payments problem: an expired card, insufficient funds, a bank declining a routine charge as suspicious. The customer never chose to go. Recurly’s July 2026 data splits SaaS churn into 2.16 percentage points voluntary and 1.06 percentage points involuntary, out of a 3.22% total.
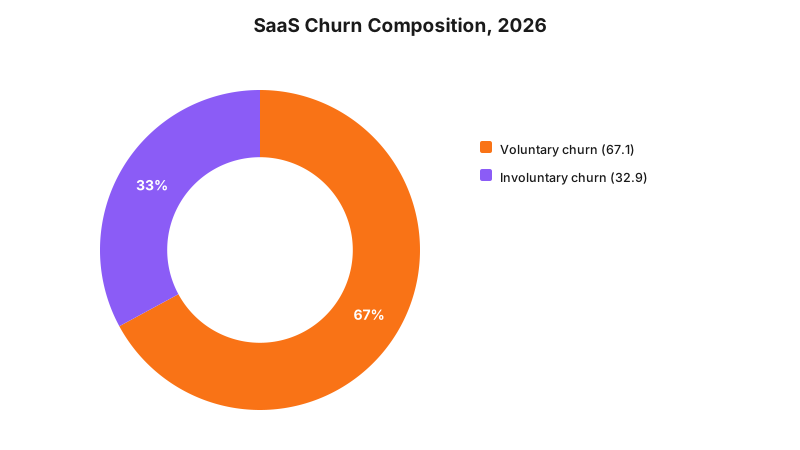
The takeaway: a third of your SaaS churn is not really about your product. It is about a card that failed silently.
Involuntary Churn by Industry, 2026
SaaS is not the worst offender, and it is not the best either. Recurly’s July 2026 network data tracks involuntary churn across six industries, and the share of total churn that is involuntary swings from 32.5% to 38.4% depending on which one you are in.
| Industry | Total churn | Involuntary churn | Involuntary share |
|---|---|---|---|
| Digital media & entertainment | 4.14% | 1.59% | 38.4% |
| Business & professional services | 3.44% | 1.18% | 34.3% |
| Education | 4.99% | 1.69% | 33.9% |
| SaaS | 3.22% | 1.06% | 32.9% |
| Travel, hospitality & entertainment | 3.91% | 1.28% | 32.7% |
| Ecommerce | 4.25% | 1.38% | 32.5% |
Source: Recurly Research, Churn rate benchmarks (July 2026 network data).
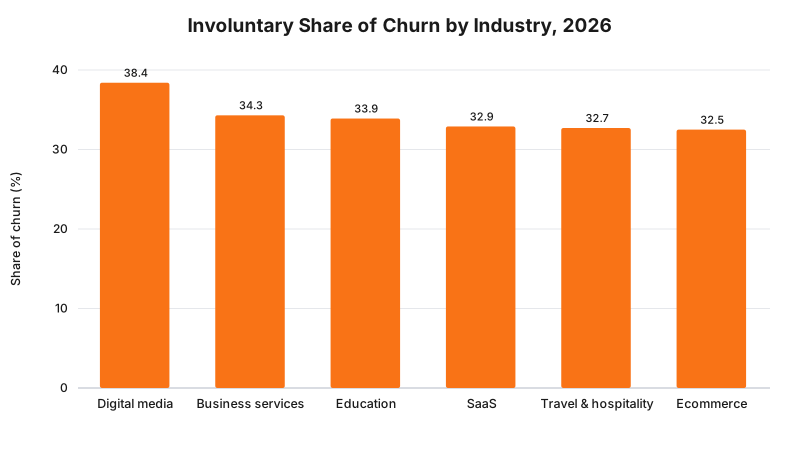
Digital media and entertainment sits highest, close to the 40% ceiling Paddle’s industry-wide estimate describes. SaaS sits in the middle of the pack, below the cross-industry average of 34.7% Recurly reports across all six industries combined.
The takeaway: no industry gets to ignore involuntary churn. Even in SaaS, the best performer here, the floor is roughly a third of total churn.
Involuntary Churn Falls as Customers Get Bigger
Industry-wide numbers hide something Recurly’s data shows clearly once you split SaaS churn by average revenue per customer, or ARPC. Small accounts fail payments far more often than large ones, relative to how much churn they generate overall.
| ARPC tier | Total churn | Involuntary churn | Involuntary share |
|---|---|---|---|
| $10 to $25 | 4.29% | 1.30% | 30.3% |
| $25 to $50 | 3.84% | 1.11% | 28.9% |
| $50 to $100 | 3.15% | 0.74% | 23.5% |
| $100 to $250 | 2.87% | 0.46% | 16.0% |
| $250 and above | 3.07% | 0.18% | 5.9% |
Source: Recurly Research, Churn rate benchmarks by ARPC tier (July 2026 data).
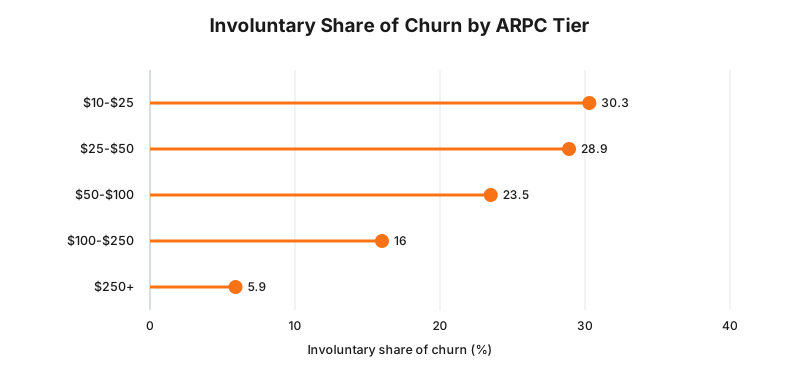
The pattern is not subtle. A customer paying $10 to $25 a month is roughly five times more likely, on a share-of-churn basis, to leave through a failed card than a customer paying $250 or more. Higher-value customers tend to use business cards with better fraud monitoring, get closer account management attention, and simply have more at stake if a subscription lapses by accident.
The takeaway: if your SaaS product sells to small accounts on personal cards, involuntary churn deserves more of your attention than the industry-wide 32.9% figure suggests.
B2B SaaS vs DTC: Why Business Model Changes the Number
Business model matters as much as price point. Baremetrics’ analysis of its own subscription customer base puts typical B2B SaaS involuntary churn at 2% to 5% a year. Direct-to-consumer subscription boxes typically run 8% to 15%, roughly three times higher.
| Business model | Typical involuntary churn rate |
|---|---|
| B2B SaaS | 2% to 5% |
| DTC subscription boxes | 8% to 15% |
Source: Baremetrics, Involuntary churn analysis (2026).
The gap comes down to who is holding the card. B2B buyers pay with company cards tied to finance department oversight, renew on annual contracts with fewer billing cycles to fail, and have a colleague notice a lapsed tool fast. DTC subscribers pay with personal cards that expire, get replaced after fraud, or simply run short of funds before the next charge, with nobody watching the account but the customer.
The takeaway: if you are benchmarking your SaaS product against the 32.9% SaaS-wide figure, check whether you are actually being compared to B2B peers or to a blended number that includes prosumer and DTC-style pricing.
What Failed Payments Actually Cost You, and What Recovers It
Involuntary churn is not just a rate. It is real revenue leaving the business every month. Baremetrics puts the average cost of failed payments at 9% of monthly recurring revenue across its subscription customer base, a number most finance teams have never put on a spreadsheet.
The good news is that involuntary churn recovers at a far higher rate than voluntary churn ever will. Structured dunning, automatic retries, card-update prompts, and multi-channel reminders recover 60% to 85% of failed payments, against 5% to 15% for retention efforts aimed at customers who cancelled on purpose.
Baremetrics’ own Recover customers show what that looks like in practice. Across 148 customers using the tool in December 2024, the group recovered $1.35 million in a single month, with the median customer earning a 410% return and 82% paying for the tool within month one. Pre-dunning emails alone see a 73% open rate and an 11% click-through rate, and personalised, multi-channel notifications cut involuntary churn by up to 34% compared with email-only sequences.
The takeaway: involuntary churn is the cheapest churn you will ever fix. Most of it is a retry setting and a reminder email away from being revenue again.
What To Do If Involuntary Churn Sits Above Benchmark
- Turn on smart retries before anything else. Most payment processors already support automatic retry logic. If yours is not switched on, this is the fastest fix on the list.
- Add card-expiry prompts inside the product, not just in email. A banner the week before a card expires catches failures before they happen.
- Use multi-channel dunning, not just email. In-app messages, SMS, and email together recover more than any single channel alone.
- Segment your involuntary churn by ARPC tier before deciding the blended number is fine. A 32.9% average can hide a $10 tier bleeding out at 30% while your $250 tier barely notices.
- Track failed-payment recovery as its own metric, separate from voluntary retention. The two problems need different owners and different fixes.
The takeaway: most involuntary churn fixes are billing and product work, not marketing spend.
Where To Go From Here
Benchmarks tell you where you stand. They do not fix a leaking payment flow. If your SaaS product is losing a third of its churned revenue to declined cards instead of unhappy customers, the fix usually sits in your billing stack, not your marketing budget.
RockingWeb builds SaaS products with billing and retry logic that catches failed payments before they turn into churn. See how we approach SaaS development, or get in touch to talk through where your involuntary churn is coming from.
Sources: Recurly Research, Churn rate benchmarks (July 2026 data); Baremetrics, Involuntary churn: how to reduce payment-failure churn (2026).
Vikas Thakur
Founder of RockingWeb. 16 years of experience from working at TPG, iiNet and Monadelphous, now building websites, software and digital marketing for local businesses in Rockingham and Perth.