SaaS ARR Growth Drops From 85% to 14% by Stage in 2025
SaaS ARR growth runs from a median 85% for companies under $1M ARR down to 14% for companies over $100M ARR, per a 2026 synthesis of 2025 survey data. This report breaks down growth rate benchmarks by ARR stage, funding type and CAC payback efficiency.
 Vikas Thakur Founder, RockingWeb 7 min read
Key takeaways
- Median ARR growth falls from 85% at under $1M ARR to just 14% above $100M ARR (SaaS Rise 2026 synthesis, 2025 data)
- Overall private SaaS growth slowed to a 22% median in 2025, down from 25% in 2024 (SaaS Capital, 14th annual survey, n=1,000+)
- Equity-backed SaaS companies held growth steady at 25% in 2025; bootstrapped companies slowed to 20%, down from 23%
- Only 7.3% of private SaaS companies reported flat or negative growth in 2025 (SaaS Capital)
- Companies growing faster than 50% a year recover customer acquisition costs in a median 10 months; companies growing 21% to 30% take 22 months (Aleph and Benchmarkit, n=342)
- Public SaaS companies posted 22% median year-on-year revenue growth in Q1 2026 across 45 non-distressed companies (Blossom Street Ventures)
- Moving Net Revenue Retention from the 90% to 100% band into the 100% to 110% band lifts growth rate by roughly 5 percentage points (SaaS Capital)
- Companies in the top NRR bracket grow at a median rate 173% higher than the overall survey population (SaaS Capital)
Answer Capsule
Median SaaS ARR growth ranges from 85% under $1M ARR to 14% above $100M ARR, per a 2026 synthesis of 2025 survey data. SaaS Capital’s 14th annual survey of 1,000+ private companies puts overall 2025 growth at 22%, down from 25% in 2024. Data covers mostly US and global private SaaS companies; no Australia-specific ARR growth benchmark of this scale exists yet.
Introduction
A SaaS company under $1M ARR grows at a median 85% a year.
One that has scaled past $100M ARR grows at just 14%.
That 71-point gap is the shape of the entire SaaS growth curve, drawn from more than 2,500 companies surveyed across 15-plus reports for 2025.
Founders quote their growth rate in every pitch deck, but most compare it to the wrong company.
A $2M ARR startup growing 30% looks slow next to a hypergrowth headline, yet it is already behind the median for its own stage.
This report breaks down ARR growth by company size, funding type and Net Revenue Retention band, so you know which number actually applies to you.
It also covers what faster growth costs you in customer acquisition efficiency.
The ARR Growth Curve, From 85% to 14%
SaaS Rise’s 2026 SaaS Benchmarks Report pools data from more than 2,500 private and public SaaS companies across 15-plus industry surveys and datasets, including SaaS Capital, Benchmarkit and High Alpha, for full-year 2025 figures. The clearest pattern in that dataset is the growth curve by ARR band.
| ARR band | Median growth, 2025 |
|---|---|
| Under $1M ARR | 85% |
| $1M to $5M ARR | 45% |
| $5M to $10M ARR | 35% |
| $10M to $25M ARR | 28% |
| $25M to $50M ARR | 22% |
| $50M to $100M ARR | 18% |
| Over $100M ARR | 14% |
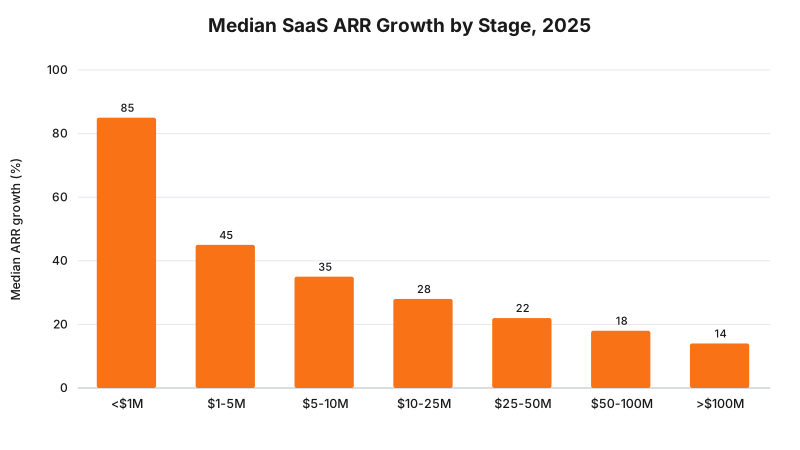
The steepest drop happens early. Companies fall from an 85% median under $1M ARR to 45% once they cross the $1M line, a 40-point fall inside a single band. Past $10M ARR, the curve flattens. Each additional band costs roughly 5 to 7 points of growth rather than 20 or 30.
Plans do not match reality at any stage. The same report puts the planned 2025 growth rate at a 35% median, roughly 9 percentage points ahead of what companies actually delivered, and notes that gap has held for three straight years.
Takeaway: if you are growing 28% at $15M ARR, you are sitting at the median for your stage, not underperforming against last year’s headline number.
Growth Is Slowing Across the Board
SaaS Capital’s 14th annual growth rate benchmark survey, covering more than 1,000 private B2B SaaS companies, puts the 2025 median growth rate at 22%, down from 25% in 2024. That headline number hides a split by funding type.
| Funding type | 2024 growth | 2025 growth |
|---|---|---|
| Bootstrapped | 23% | 20% |
| Equity-backed | 25% | 25% |
| All companies | 25% | 22% |
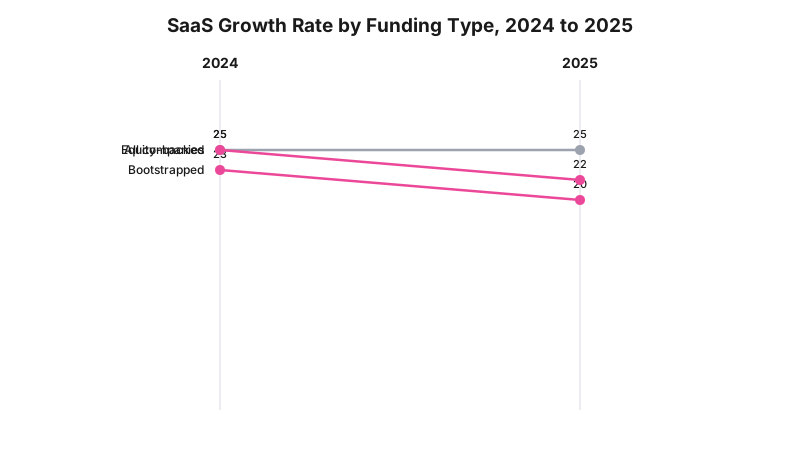
Equity-backed companies held their growth rate flat. Bootstrapped companies absorbed the entire slowdown, dropping three points to 20%. Neither group is close to stalling: SaaS Capital found only 7.3% of companies in the survey reported flat or negative growth in 2025.
Takeaway: the 2025 slowdown landed almost entirely on bootstrapped companies. If you are self-funded and growth cooled, you are following the market, not falling behind it.
Net Revenue Retention Explains Part of the Gap
Only 7.3% of companies in SaaS Capital’s survey stalled out or shrank in 2025.
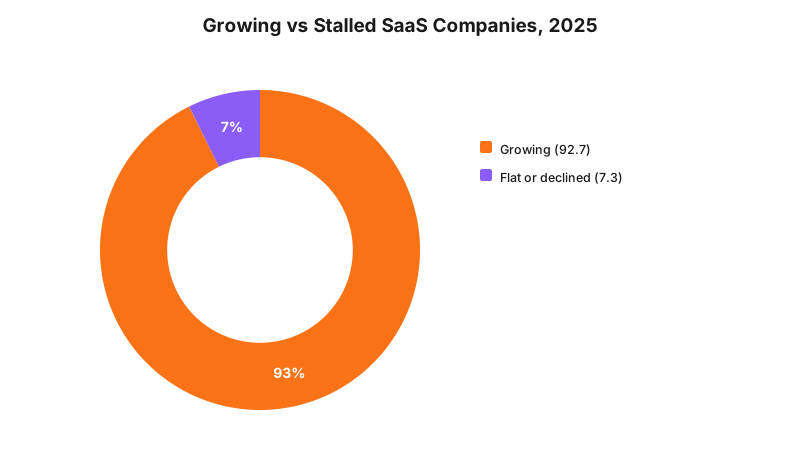
Net Revenue Retention drives a large share of who ends up growing and who does not. Companies in the top NRR bracket grow at a median rate 173% higher than the overall survey population. Moving NRR from the 90% to 100% band into the 100% to 110% band lifts growth rate by roughly 5 percentage points, on the same dataset.
That relationship makes NRR a leading indicator. A slipping NRR number tends to show up months before the topline growth rate moves, because it is measuring the same customers you already have, not the ones you have yet to close.
Takeaway: a shrinking NRR number is often the first sign of a growth slowdown, well before it shows up in your reported ARR growth rate.
Faster Growth Costs More to Buy
Aleph and Benchmarkit’s 2026 SaaS and AI Performance Benchmarks report surveyed 342 B2B SaaS and AI-native companies, with 198 reporting CAC payback specifically, for full-year 2025 actuals. Growth rate and CAC payback move together, but not in a straight line.
| Growth rate cohort | Median CAC payback |
|---|---|
| Above 50% growth | 10 months |
| 21% to 30% growth | 22 months |
| 11% to 20% growth | 18 months |
| Below 14% growth | 14 months |
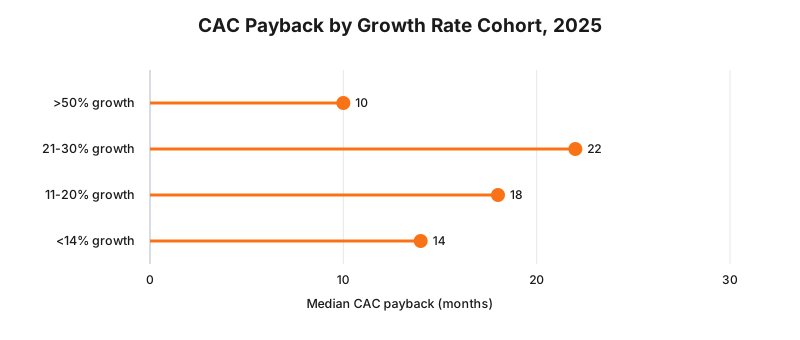
The worst payback sits in the middle, not at the bottom. Companies growing 21% to 30% take a median 22 months to recover CAC, four months longer than companies growing under 14%. That cohort is spending hard to break out of the mid-growth band without yet having the sales efficiency that either earlier or more mature companies settle into.
Takeaway: if your growth rate sits in the 20s and CAC payback keeps stretching past 20 months, you are not an outlier. That is where this dataset found the least efficient spending of any growth band.
What Counts as Good Growth at Your Stage
None of this works as one number to chase. A $500,000 ARR company growing 40% is behind its stage’s 85% median. A $60M ARR company growing 20% is ahead of its 18% median at that size. Match your growth rate to your own ARR band before you panic or celebrate.
Public SaaS companies offer a useful anchor too. Forty-five non-distressed public SaaS companies posted 22% median year-on-year revenue growth in Q1 2026, per Blossom Street Ventures, almost identical to SaaS Capital’s 22% private-company median for the same year. That convergence is new. Public and private growth rates ran further apart through most of 2023 and 2024.
Growth rate alone will not tell you the full story either. Our Rule of 40 benchmark report shows only 15% of public SaaS companies clear a combined growth-plus-profit score of 40, and our SaaS CAC payback benchmarks cover the acquisition-cost side of that same equation in more depth. If churn or gross margin is quietly dragging on your growth number, our SaaS churn rate benchmarks and gross margin benchmark posts cover the two metrics most likely to be masking the real trend.
Takeaway: compare your growth rate to your own ARR band first. The loudest number in your feed is rarely the one that applies to your stage.
Where to Go From Here
If your growth rate has slowed and you are not sure whether that is normal for your stage or a sign the product needs work, run your numbers through our SaaS valuation calculator to see how growth and margin translate into a multiple. If the constraint is technical, an engineering team that cannot ship fast enough to sustain your stage’s median growth rate, our SaaS development team rebuilds and scales SaaS products for exactly that problem. Book a consultation to talk through where your growth rate actually sits against these benchmarks.
Sources and References
- SaaS Rise, 2026 SaaS Benchmarks Report, synthesis of 2,500+ companies across 15+ surveys including SaaS Capital, Benchmarkit and High Alpha, 2025 data
- SaaS Capital, 2026 Private B2B SaaS Company Growth Rate Benchmarks, 14th annual survey, n=1,000+ private B2B SaaS companies, 2025 data
- Aleph and Benchmarkit, 2026 SaaS and AI Performance Benchmarks, n=342 (198 reporting CAC payback), full-year 2025 actuals
- Blossom Street Ventures, Q1 2026 SaaS Data Shows Improving Profitability and Steady Growth, n=45 non-distressed public SaaS companies
Note: this is a global, mostly US-listed and US-headquartered dataset. No Australia-specific SaaS ARR growth benchmark of comparable scale currently exists, so treat these figures as international context rather than a local Australian benchmark.
Vikas Thakur
Founder of RockingWeb. 16 years of experience from working at TPG, iiNet and Monadelphous, now building websites, software and digital marketing for local businesses in Rockingham and Perth.