16-Month SaaS CAC Payback Period: The 2025 Benchmark Data
The median SaaS CAC payback period is 16 months in 2025, according to Benchmarkit's SaaS Performance Metrics report. That is down from 18 months in 2024, and deal size still matters, though not in the simple straight-line way most benchmarks assume.
 Vikas Thakur Founder, RockingWeb 12 min read
On this page 12
- Key takeaways
- The 2025 SaaS CAC Payback Benchmark, Year by Year
- Why a Single Year’s Number Can Mislead You
- CAC Payback by Deal Size: Not a Straight Line
- Best vs Worst Performers: The New CAC Ratio Gap
- How the KeyBanc Private SaaS Survey Compares
- Retention, Margin, and Growth Behind the Payback Number
- How to Calculate Your Own CAC Payback Period
- What This Means for Your Own SaaS Business
- Frequently Asked Questions
- Get a Second Opinion on Your SaaS Product
- Sources
Key takeaways
- The median SaaS CAC payback period is 16 months in 2025, down from 18 months in 2024, according to Benchmarkit’s SaaS Performance Metrics report
- The 2022 median was also 16 months, so the metric has round-tripped over three years rather than trending in one direction
- Deal size still matters, but not in a straight line: Benchmarkit’s 2025 data shows enterprise deals over $250,000 ACV have materially longer payback than mid-market deals in the $50,000 to $100,000 and $25,000 to $50,000 ranges
- Efficiency varies enormously between companies: Benchmarkit’s related New CAC Ratio metric shows the bottom quartile spending $2.82 to acquire $1 of new ARR, versus $2.00 at the median, a 41% gap Benchmarkit does not attribute to any single cause
- Median net revenue retention sits at 101% and median gross margin at 77%, both from Benchmarkit’s 2025 dataset
- Benchmarkit’s median ARR growth was 26% in 2024 (actual), while companies were planning for a median 35% growth rate in 2025, and KeyBanc’s private SaaS survey recorded 15% actual growth for that same year
- KeyBanc and Sapphire Ventures’ private SaaS survey projects ARR growth accelerating from 15% in 2024 to 20% in 2025
- That same survey group reports gross retention approaching 90%, up from 86% in 2023; its most recently disclosed CAC payback figure is an older median of about 23 months, reported for 2022, not a newer projection
The median SaaS CAC payback period is 16 months in 2025, according to Benchmarkit’s SaaS Performance Metrics report. That figure blends B2B SaaS companies of every size and stage, not one specific country. A separate KeyBanc Capital Markets and Sapphire Ventures survey of larger private SaaS companies last disclosed a median account-level payback of about 23 months, reported for 2022, the most recent figure that survey group has made public.
The 2025 SaaS CAC Payback Benchmark, Year by Year
The median SaaS CAC payback period sits at 16 months in 2025, and that single number decides whether your growth is funded by revenue or by your next raise. Benchmarkit’s SaaS Performance Metrics report tracked B2B SaaS companies through a rough stretch: median payback jumped from 14 months in 2023 to 18 months in 2024, then eased back to 16. Deal size still moves that number, though not in the straight line most founders assume: Benchmarkit’s data shows the biggest enterprise deals taking materially longer to pay back than mid-market deals, not less. Knowing where you sit against those numbers tells you whether your sales and marketing spend is buying growth or burning runway. Below is the full 2025 trend line, the deal-size breakdown, a proxy for the efficiency spread between companies, and how the separate KeyBanc private SaaS survey stacks up against Benchmarkit’s blended figures.
Look at the raw numbers across four years and the picture is less of a trend and more of a round trip. Benchmarkit states directly that CAC payback increased 12.5% at the median since 2022, and the maths checks out: 16 months in 2022, up to 18 in 2024, a 12.5% jump. By full-year 2025 data, the median was back down to 16 months, the same level it started at.
| Year | Median CAC Payback (Months) | Source |
|---|---|---|
| CY2022 | 16 | Benchmarkit |
| CY2023 | 14 | Benchmarkit |
| CY2024 | 18 | Benchmarkit |
| CY2025 | 16 | Benchmarkit |
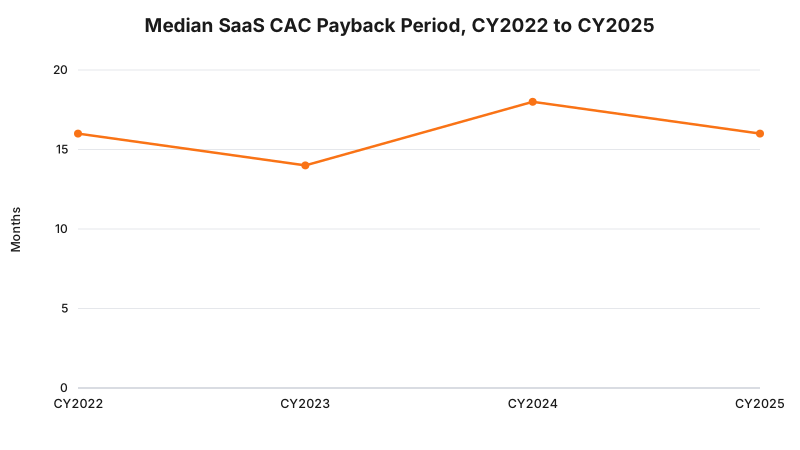
The median CAC payback period is back to where it started three years ago: 16 months, not the improvement it might look like next to 2024’s 18-month spike.
Why a Single Year’s Number Can Mislead You
A payback period is only a median across whichever companies reported that year. Shift the mix of company stages and deal sizes in the sample, and the median moves even if no individual company changed how it sells. That is worth remembering before reading too much into a single year’s swing from 14 to 18 and back to 16 months.
The more reliable read comes from segmenting by deal size, because average contract value explains most of the spread between an efficient payback period and a slow one. A company selling $2,000-a-year subscriptions and a company selling $80,000 enterprise contracts should never be judged against the same 16-month median. Both are covered separately below.
The lesson: judge your own payback period against companies your size and deal structure, not against one blended industry number.
CAC Payback by Deal Size: Not a Straight Line
Benchmarkit’s 2025 data breaks CAC payback down by average contract value (ACV), and the pattern is not the one most founders expect. Rather than payback getting steadily worse as deal size climbs, Benchmarkit found that enterprise deals over $250,000 ACV have materially longer payback than mid-market deals in the $50,000 to $100,000 and $25,000 to $50,000 ranges. Benchmarkit has not published exact month-by-month figures for each band publicly, only the comparative finding, but it is enough to overturn the assumption that bigger contracts always recover faster.
The likely explanation flips the usual assumption. Enterprise deals carry longer sales cycles, more implementation and onboarding work, and bigger commissions baked into the acquisition cost, all of which stretch out the months needed to recoup that spend even though the contract itself is large. Benchmarkit frames this as a trade-off rather than a red flag: an enterprise deal that takes longer to break even can still out-earn a smaller one over the life of the customer.
| Deal Size (ACV) | CAC Payback vs Other Bands | Source |
|---|---|---|
| $25,000 to $50,000 | Baseline efficiency | Benchmarkit, 2025 |
| $50,000 to $100,000 | Similar to the $25K-$50K band | Benchmarkit, 2025 |
| Over $250,000 | Materially longer payback than both bands above | Benchmarkit, 2025 |
If your CAC payback period looks worse than the 16-month blended median and your average contract value sits in the enterprise range, that alone can explain a meaningful chunk of the gap.
Best vs Worst Performers: The New CAC Ratio Gap
The median only tells part of the story, and Benchmarkit does not publish a public top-quartile-versus-bottom-quartile breakdown of the CAC payback period itself. It does publish quartile data for a closely related measure, the New CAC Ratio, defined as dollars spent to acquire one dollar of new annual recurring revenue. The bottom quartile of companies spends $2.82 at median to land $1.00 of new ARR, against $2.00 at the median across the whole sample, a 41% gap between typical and worst-case efficiency.
Companies with a lower, better New CAC Ratio typically run tighter sales cycles, lean more on self-serve or product-led motion, or price in a way that front-loads revenue relative to acquisition spend. None of that is a guarantee, and Benchmarkit’s report does not attribute the gap to any single cause. What this ratio and the deal-size pattern above both show is that the 16-month blended payback median leaves enormous room either side of it, so no single company should benchmark itself against that number alone.
| Percentile | New CAC Ratio ($ spent per $1 of new ARR) |
|---|---|
| Median | $2.00 |
| Bottom quartile | $2.82 |
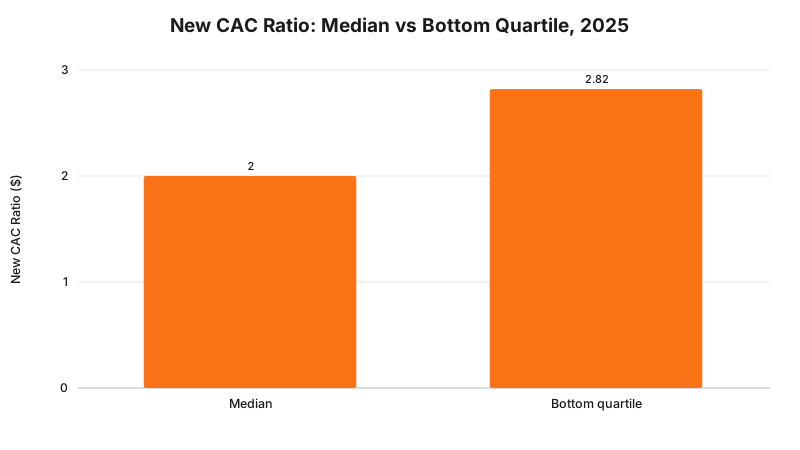
A 41% gap between the median and bottom-quartile New CAC Ratio is a reminder that the industry’s blended figures are a starting point for comparison, not a target to hit exactly.
How the KeyBanc Private SaaS Survey Compares
Benchmarkit is not the only source tracking this. KeyBanc Capital Markets and Sapphire Ventures run their own Private SaaS Company Survey, now in its 16th year, and it covers a different population: larger, later-stage private SaaS companies rather than Benchmarkit’s blended mix of every stage.
That survey’s 2025 release projects ARR growth accelerating from 15% in 2024 to 20% in 2025, gross retention approaching 90% after sitting at 86% in 2023, and net revenue retention holding above 100%. The most recent CAC payback figure that survey group has made public is an older median of about 23 months, reported for 2022, not a current or projected number, so it is not a reliable point of comparison against Benchmarkit’s 16-month CY2025 median. The two surveys will not line up exactly on the metrics that do overlap, because they are sampling different companies with different methodologies, but the direction matters more than the decimal point: both point toward improving growth and retention after a rougher 2023 to 2024 stretch.
| Metric | KeyBanc / Sapphire Survey (Private SaaS) | Benchmarkit (Blended B2B SaaS) |
|---|---|---|
| ARR growth rate | 15% actual (2024) to 20% projected (2025) | 26% actual (2024), 35% planned (2025) |
| Gross retention | Approaching 90% (2025), up from 86% in 2023 | Not disclosed |
| Net revenue retention | Above 100% (2025) | 101% median (2025) |
| CAC payback (account level) | ~23 months median, most recently reported for 2022 | 16 months median, CY2025 |
Two surveys, two different populations, and the metrics that do overlap point the same direction: SaaS growth and retention are recovering from the 2023 to 2024 dip, even where the exact figures differ by methodology. CAC payback is the one line in this table where the two sources are not comparable, since KeyBanc and Sapphire have not published an updated figure since 2022.
Retention, Margin, and Growth Behind the Payback Number
CAC payback period does not move on its own. It is a function of how much you spend to acquire a customer, how much revenue that customer generates each month, and what share of that revenue is gross margin rather than cost of service. Benchmarkit’s 2025 dataset puts median net revenue retention at 101% and median gross margin at 77%. Median ARR growth was 26% for 2024 actuals, with companies planning for a median 35% growth rate in 2025, what Benchmarkit calls the “optimistic nature of SaaS companies.”
A higher gross margin shortens payback for the same spend and the same revenue, because more of each dollar collected goes toward recouping the acquisition cost rather than covering delivery costs. A company with 90% gross margin recovers a given CAC faster than a company with 60% gross margin, even if both charge identical prices and spend identical amounts to acquire each customer.
| Metric | Benchmarkit Median |
|---|---|
| Net revenue retention (2025) | 101% |
| Gross margin (2025) | 77% |
| ARR growth rate (2024 actual) | 26% |
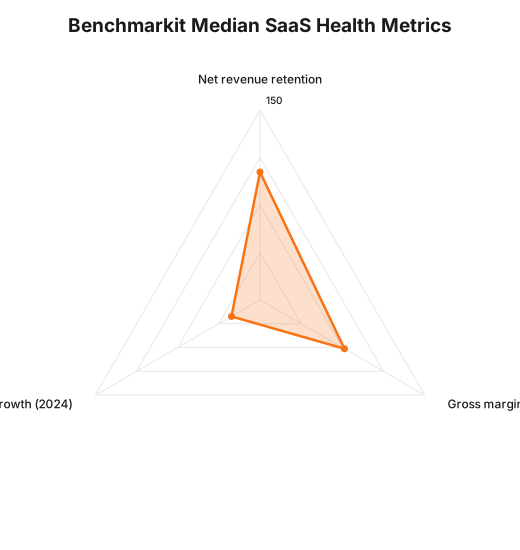
Payback period is a symptom, not a root cause. Retention, margin, and growth rate together explain why it moves.
How to Calculate Your Own CAC Payback Period
The formula stays the same regardless of what the industry median does in any given year. Divide your fully loaded customer acquisition cost by your monthly recurring revenue per customer, multiplied by your gross margin percentage.
Say a company spends $6,000 to acquire a customer, that customer pays $500 a month, and gross margin runs at 75%. Monthly gross profit from that customer is $375. Divide $6,000 by $375 and the payback period comes out to 16 months, right on this year’s blended median. Change the gross margin to 90% instead of 75%, and the same customer pays back in a little over 13 months, without a single dollar of extra revenue.
That is the lever most founders underuse. Cutting delivery costs or renegotiating a hosting contract can shorten payback just as effectively as spending less on ads, and it does not touch your growth rate.
What This Means for Your Own SaaS Business
A 16-month blended median is a reference point, not a verdict. Check your own number against the deal-size band that matches your business, not the headline figure, and check your New CAC Ratio against the $2.00 median before deciding your sales and marketing spend needs a rethink.
If your CAC payback period is stuck well past 18 months and your average contract value does not explain it, the fastest fix usually is not a bigger marketing budget. It is tightening the product itself: a faster onboarding flow, fewer support tickets per customer, and a gross margin that does not quietly leak revenue into infrastructure costs.
Frequently Asked Questions
What is the median SaaS CAC payback period in 2025?
The median is 16 months, according to Benchmarkit’s SaaS Performance Metrics report. That is down from 18 months in 2024, and back to the same level recorded in 2022.
What is a good CAC payback period for SaaS?
Under 12 months is the commonly cited industry benchmark for an efficient CAC payback period, according to Benchmarkit. Benchmarkit does not publish exact top- and bottom-quartile payback figures, but a related measure, the New CAC Ratio, shows the bottom quartile of companies spending $2.82 to acquire $1 of new ARR, against $2.00 at the median, so efficiency varies enormously company to company.
Does deal size affect CAC payback period?
Yes, but not in a straight line. Benchmarkit’s 2025 data shows enterprise deals over $250,000 ACV have materially longer payback than mid-market deals in the $50,000 to $100,000 and $25,000 to $50,000 ranges, even though larger contracts tend to be more profitable over the life of the customer. Benchmarkit has not published exact month-by-month figures for each ACV band.
How does the KeyBanc private SaaS survey compare to Benchmarkit’s numbers?
They track different populations. KeyBanc and Sapphire Ventures survey larger, later-stage private SaaS companies, and their most recently disclosed CAC payback figure is a median of about 23 months, reported for 2022. Benchmarkit’s figures blend companies of every stage and size and reflect full-year 2025 data, so treat the two as directionally useful rather than directly comparable.
Get a Second Opinion on Your SaaS Product
Building or rebuilding a SaaS product with these numbers in mind, from day one, tends to beat retrofitting efficiency into a product that was not built for it. See how RockingWeb approaches SaaS development for Australian founders who want their product architecture to support a shorter payback period, not fight it.
Want to model how your own retention, margin, and growth numbers affect valuation? Try the SaaS Valuation Calculator.
Or get in touch to talk through where your CAC payback period sits and what is driving it.
Sources
- Benchmarkit, SaaS Performance Metrics Benchmarks report, 2025 data
- Drivetrain, CAC Payback Period: Formula, Benchmarks & How to Reduce It, referencing Benchmarkit’s report
- Sapphire Ventures, KeyBanc Capital Markets and Sapphire Ventures Private SaaS Company Survey press release, reporting 2022 data (the most recent CAC payback figure this survey group has published)
- KeyBanc Capital Markets, Private SaaS Company Survey press release, 2025
Note: Benchmarkit’s dataset blends B2B SaaS companies across stages and is not Australia-specific. The KeyBanc and Sapphire Ventures survey covers larger private SaaS companies globally. Neither report discloses an Australia-only breakdown; treat these as international benchmarks to compare against, not local averages.
Vikas Thakur
Founder of RockingWeb. 16 years of experience from working at TPG, iiNet and Monadelphous, now building websites, software and digital marketing for local businesses in Rockingham and Perth.