3.22%: SaaS Churn Rate Benchmarks by Industry (2026)
SaaS companies churn at 3.22% a year, the lowest rate of any subscription industry Recurly tracked in 2026. Here is how that number breaks down by industry and company size.
 Vikas Thakur Founder, RockingWeb 8 min read

On this page 9
Key takeaways
- SaaS churns at 3.22% a year, the lowest annual churn rate of any subscription industry Recurly tracked in its July 2026 benchmark report.
- Education has the highest churn among the six industries Recurly measured, at 4.99% a year, nearly 1.6 times the SaaS rate.
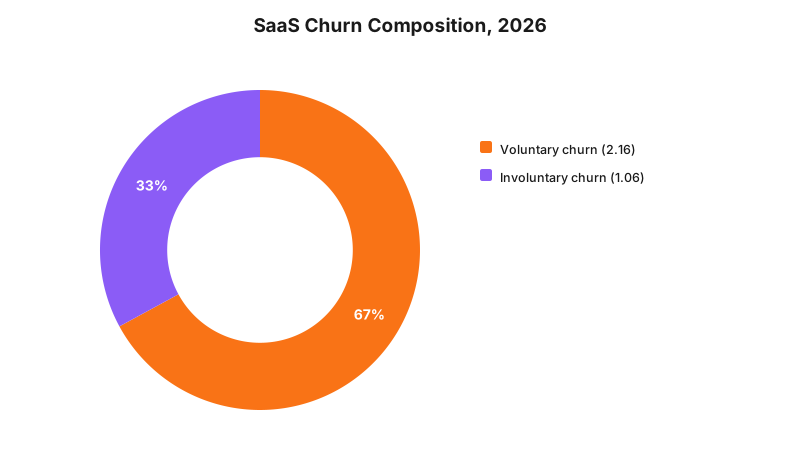
- Voluntary cancellations make up 2.16 points of that 3.22%. Involuntary payment failures account for the remaining 1.06 points.
- Enterprise SaaS companies churn at 10% or less a year. SMB-focused SaaS software can lose 30% to 58% of its customer base annually.
- Median Gross Revenue Retention for private B2B SaaS sits at 88%, with Net Revenue Retention at 101%, according to Benchmarkit’s 2025 report.
- Recurly classes anything under 2% annual churn as strong performance, a bar only a small share of SaaS companies clear.
Quick Answer
SaaS companies had a median annual churn rate of 3.22% in 2026, the lowest of any subscription industry, according to Recurly Research (July 2026 data). Enterprise SaaS sits near 10% or below; SMB SaaS software churns 30% to 58% a year, per Vena Solutions’ 2025 review of Recurly and Paddle data.
SaaS Has the Lowest Churn of Any Subscription Industry
SaaS churns at 3.22% a year. That is the median across every SaaS company Recurly tracked in its July 2026 churn benchmark data, and it is the lowest annual churn rate of any subscription industry the firm measured. Ecommerce sits at 4.25%. Education sits at 4.99%. If your churn rate reads anywhere near double digits, you are not just behind the SaaS median, you are behind almost every other subscription business too. This report breaks the number down by industry and company size, so you can see exactly where your product sits and what a healthy range actually looks like.
What Counts as a Good SaaS Churn Rate
Churn rate is the share of customers, or the share of recurring revenue, a business loses over a set period. Most benchmark reports report it two ways: as a customer count (logo churn) and as a revenue figure (revenue churn). This report uses revenue churn unless stated otherwise, since that is what Recurly’s industry data measures.
Churn also splits into two causes. Voluntary churn is a customer choosing to cancel. Involuntary churn is a failed card, an expired payment method, or a billing error that quietly ends a subscription nobody meant to lose. For SaaS specifically, Recurly’s July 2026 data puts the 3.22% total at 2.16% voluntary and 1.06% involuntary, so roughly a third of all churned revenue never involved a customer deciding to leave.
Recurly’s own benchmark for “strong” performance is under 2% annual churn, a level it says only a small share of subscription businesses sustain without active retention and recovery programmes. Below that line, involuntary churn recovery (retrying failed payments, updating expired cards automatically) usually matters as much as reducing voluntary cancellations.
The takeaway: SaaS churn is a two-part problem, and the involuntary third is often the cheaper one to fix first.
SaaS Churn Rate by Industry, 2026
Here is the full picture from Recurly’s July 2026 network data, covering the six industries it tracks for churn.
| Industry | Total annual churn | Voluntary | Involuntary |
|---|---|---|---|
| SaaS | 3.22% | 2.16% | 1.06% |
| Business & professional services | 3.44% | 2.27% | 1.18% |
| Travel, hospitality & entertainment | 3.91% | 2.63% | 1.28% |
| Digital media & entertainment | 4.14% | 2.55% | 1.59% |
| Ecommerce | 4.25% | 2.87% | 1.38% |
| Education | 4.99% | 3.30% | 1.69% |
Source: Recurly Research, “Churn rate benchmarks: SaaS, media, retail & more industries”, July 2026 network data.
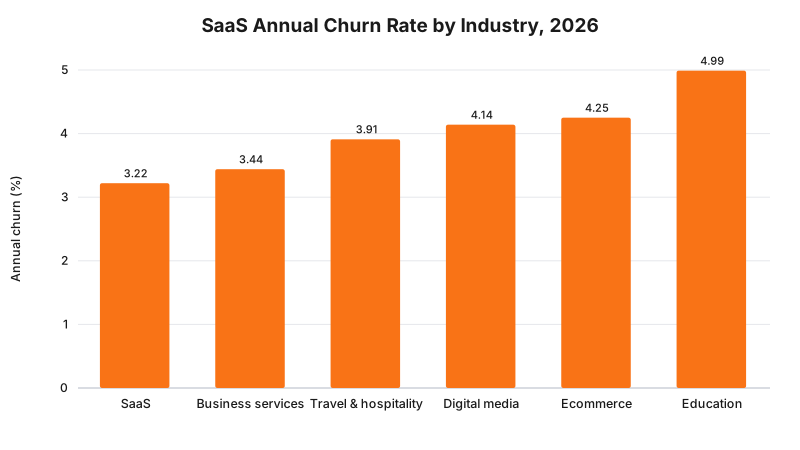
The pattern holds even against the wider average. Recurly puts the all-industry average churn at 3.6%, which means SaaS sits below the average by a meaningful margin, and every other tracked industry sits at or above it. Independent numbers point the same direction. Vena Solutions’ 2025 review of Recurly and Paddle data puts overall B2B SaaS churn at 3.5% to 5% a year, which lines up with Recurly’s own 3.22% figure inside a normal reporting range.
The takeaway: if your SaaS product churns above roughly 4%, you are behind the median for your own industry, not just behind some abstract “good” number.
SaaS Churn Rate by Company Size
Industry-wide medians hide a wide spread by customer segment. Vena Solutions’ 2025 analysis, drawing on Recurly and Paddle transaction data from Q1 and Q2 2025, breaks SaaS churn out by who the customer is.
| Segment | Annual churn | Source |
|---|---|---|
| Enterprise SaaS | 10% or less | Recurly / Paddle, Vena Solutions 2025 |
| B2B SaaS overall | 3.5% to 5% | Recurly / Paddle, Vena Solutions 2025 |
| SMB SaaS, low end | 30% | Recurly / Paddle, Vena Solutions 2025 |
| SMB SaaS, high end | 58% | Recurly / Paddle, Vena Solutions 2025 |
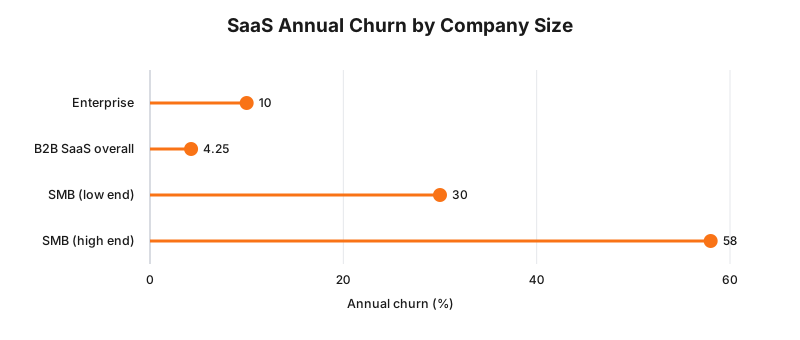
The gap between enterprise and SMB SaaS is not small. A company selling to small businesses can lose more than half its customer base in a single year and still be within a published, unremarkable range. That is not a sign something is broken. It reflects lower switching costs, shorter contract terms, and less onboarding investment per account at the SMB end. If you sell to SMBs and your churn sits near 30%, you are tracking the low end of a normal range, not failing.
The takeaway: compare your churn to your own segment, not to the SaaS-wide median. Enterprise and SMB numbers are not the same benchmark.
What Churn Rate Alone Does Not Tell You
Churn rate counts customers or revenue lost. It says nothing about what you are gaining from the customers who stay. That is where retention metrics come in.
Benchmarkit’s 2025 report on private B2B SaaS companies puts median Gross Revenue Retention (GRR) at 88% for 2024, down slightly from 90% three years earlier. Net Revenue Retention (NRR), which adds back expansion revenue from upsells and add-on seats, sits at a median 101%.
| Metric | 2024 median | What it measures |
|---|---|---|
| Gross Revenue Retention | 88% | Revenue kept, before any expansion |
| Net Revenue Retention | 101% | Revenue kept, including upsells |
Source: Benchmarkit, “2025 SaaS Performance Metrics”, private B2B SaaS survey.
An 88% GRR means roughly 12% of revenue is lost each year to downgrades and cancellations, a number consistent with the churn range this report covers once you account for revenue churn running higher than logo churn at some ARPA bands. A 101% NRR means expansion revenue from existing customers is just barely outpacing that loss. Barely positive is not the same as healthy. Benchmarkit notes NRR compressing toward 100% is a sign that retaining and growing existing accounts is getting harder across the board, not easier.
The takeaway: a low churn rate and a flat NRR can both be true at once. Check both numbers before deciding your retention story is fine.
What To Do If Your Churn Sits Above Benchmark
A handful of moves tend to close the gap between an average churn rate and a strong one, in rough order of effort required.
- Fix involuntary churn first. Automated payment retries and card-update prompts recover revenue nobody actively chose to cancel, and this is usually the cheapest fix on the list.
- Measure churn by segment, not as one blended number. A blended 6% churn rate can hide a healthy 2% enterprise book dragged down by a struggling SMB tier, or the reverse.
- Track time-to-value in the product, not just in sales. Customers who reach their first meaningful result inside the first week churn less than those who do not, across nearly every SaaS category benchmarked here.
- Revisit pricing and packaging if churn concentrates in your lowest tier. A plan priced below the cost of supporting it often churns hard because it attracts the wrong customer, not because the product is failing.
The takeaway: most churn reduction work is product and billing work before it is marketing work.
Frequently Asked Questions
What is a good SaaS churn rate in 2026?
Under 2% annual churn counts as strong performance across almost any SaaS segment, according to Recurly Research (July 2026). The overall SaaS median sits at 3.22%.
Is SaaS churn higher or lower than other industries?
Lower. SaaS had the lowest annual churn rate of the six industries Recurly tracked in its July 2026 benchmark data, at 3.22% against a 3.6% all-industry average.
What is the difference between voluntary and involuntary churn?
Voluntary churn is a customer actively cancelling. Involuntary churn is a failed payment, expired card, or billing error. SaaS splits roughly 2.16% voluntary to 1.06% involuntary.
Why does SMB SaaS churn so much more than enterprise SaaS?
Smaller customers have lower switching costs, shorter contracts, and less onboarding investment. SMB SaaS software can lose 30% to 58% of customers a year against 10% or less for enterprise.
Where To Go From Here
Benchmarks tell you where you stand. They do not fix a churn problem. If your SaaS product is losing customers faster than these numbers suggest it should, the cause usually sits in onboarding, product depth, or billing reliability, not in how much you spend on new leads.
RockingWeb builds and rebuilds SaaS products for founders who need software that keeps the customers it signs up, not just more of them at the top of the funnel. See how we approach SaaS development, or get in touch to talk through where your churn is coming from.
Sources: Recurly Research, Churn rate benchmarks (July 2026 data); Vena Solutions, SaaS Churn Rate: Benchmarks, Formulas and Calculator (2025); Benchmarkit, 2025 SaaS Performance Metrics.
Vikas Thakur
Founder of RockingWeb. 16 years of experience from working at TPG, iiNet and Monadelphous, now building websites, software and digital marketing for local businesses in Rockingham and Perth.