30.3% Churn: Australia's Small Business Failure Rate
Australia's small business churn rate hit 30.3% in 2024-25, according to the ABS, as 437,150 new businesses entered the market and 370,500 exited. Here is what the ABS, ASIC and CommBank data actually show about why businesses fail and where the risk sits by industry.
 Vikas Thakur Founder, RockingWeb 9 min read
Key Takeaways
- Australia’s combined business churn rate hit 30.3% in 2024-25: 437,150 entries plus 370,500 exits against 2,729,648 actively trading businesses (ABS, released December 2025)
- The business population still grew by a net 2.5% over the same year, 66,650 more businesses than the year before
- 14,722 companies entered external administration in FY2024-25, the highest annual total on record, per ASIC data
- That eased to 14,011 companies in FY2025-26, still close to three times the pandemic-era low of 4,912 in FY2021-22
- Construction stayed the single biggest source of company failures: 3,472 external administrations in FY2025-26 alone
- Accommodation and food services followed with 2,078 companies entering administration in FY2025-26, down 16% from 2,476 the year before
- Nearly 80% of Australian small and medium businesses reported a cash flow hit in the past 12 months, per CommBank-commissioned research published January 2025
- Non-employing businesses, the category most new entrants fall into, had an 83.8% survival rate one year in, per ABS entry cohort data for June 2021 to June 2022, rising sharply for businesses with employees
Australia’s small business churn rate was 30.3% in the 2024-25 financial year, per the Australian Bureau of Statistics. That figure combines a 16.4% entry rate with a 13.9% exit rate across 2.73 million actively trading businesses. It measures total market turnover, not a single business’s odds of failing within a set number of years.
Thirty percent of Australia’s business population turned over in the 2024-25 financial year. The Australian Bureau of Statistics counted 437,150 new businesses entering the market and 370,500 leaving it, a combined churn of 30.3% against 2.73 million actively trading businesses. That number gets thrown around as a failure rate, but it isn’t one. It blends genuine closures with owners retiring, restructuring into a new entity, or simply not renewing an ABN. The real failure signal sits elsewhere. ASIC recorded 14,722 companies entering external administration in FY2024-25, the highest annual total on record, before easing slightly to 14,011 the following year. Construction and hospitality carried most of that load. This post walks through what the ABS, ASIC and CommBank data actually say, industry by industry, so you know which numbers to trust.
What “Business Churn” Actually Means
The 30.3% figure comes from adding two separate ABS rates together. The entry rate, businesses starting up, was 16.4% in 2024-25. The exit rate, businesses closing for any reason, was 13.9%. Add them and you get a combined churn of 30.3%, or 807,650 businesses either entering or leaving the market against a base of 2,729,648 actively trading at 30 June 2025.
Churn is not the same as failure. An exit in the ABS count includes a sole trader retiring, a business restructuring into a new ABN, a company merging with another, and a business genuinely going broke, all lumped into one line. The ABS does not split exits by reason. What the churn figure does tell you is how fast the Australian business landscape turns over: for every ten businesses trading today, roughly three either just arrived or are about to leave within the year.
The upside in the same dataset is easy to miss next to a 30% headline number. The business population still grew by a net 2.5% in 2024-25, 66,650 more businesses than the year before. More businesses started than closed. Churn is high, but it is not a sign the economy is shrinking.
| Metric (2024-25, ABS) | Figure |
|---|---|
| Business entries | 437,150 (16.4% entry rate) |
| Business exits | 370,500 (13.9% exit rate) |
| Combined churn rate | 30.3% |
| Actively trading businesses, 30 June 2025 | 2,729,648 |
| Net business growth | +2.5% (66,650 businesses) |
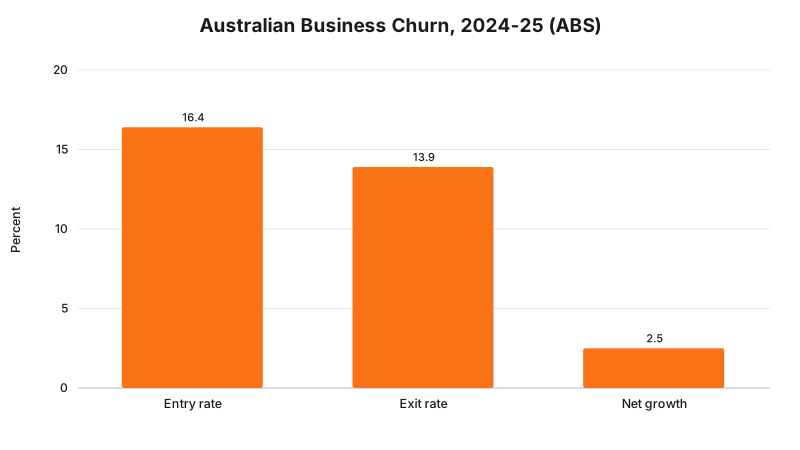
Takeaway: the 30.3% churn figure is entries plus exits combined, not a failure rate, and the same dataset shows net business growth of 2.5% in the same year.
How Many Companies Actually Fail: ASIC’s Insolvency Data
If churn is the wrong number for “how many businesses fail”, ASIC’s external administration count is closer to the right one. It tracks companies that entered liquidation, voluntary administration, receivership, or small business restructuring, a genuine failure signal rather than a mix of retirements and rebrands.
14,722 companies entered external administration in FY2024-25, the highest annual figure on record and more than 34% above the FY2023-24 total of 11,049. That eased to 14,011 in FY2025-26, a small step down but still close to three times the pandemic-era low of 4,912 recorded in FY2021-22, when government support kept marginal businesses afloat.
| Financial year | Companies in external administration |
|---|---|
| 2021-22 | 4,912 |
| 2023-24 | 11,049 |
| 2024-25 | 14,722 |
| 2025-26 | 14,011 |
The jump from 2021-22 to 2024-25 is not subtle. Pandemic-era support schemes, rent relief, and a temporary insolvency safe harbour held company failures at an artificially low level for two years. Once that support ended, the backlog of already-struggling companies worked its way through the system. The FY2025-26 dip suggests that catch-up wave has largely passed, not that conditions have eased.
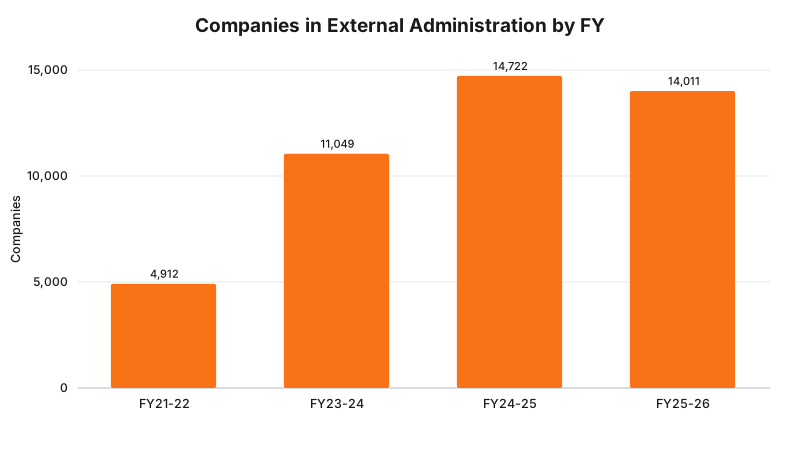
Takeaway: genuine company failures, per ASIC, are running at close to three times the pandemic-era low, even after a small drop in FY2025-26.
Which Industries Carry the Most Risk
Failure risk is not spread evenly. Two industries account for a disproportionate share of every year’s insolvency count, and the pattern has held steady across the last three financial years of ASIC data.
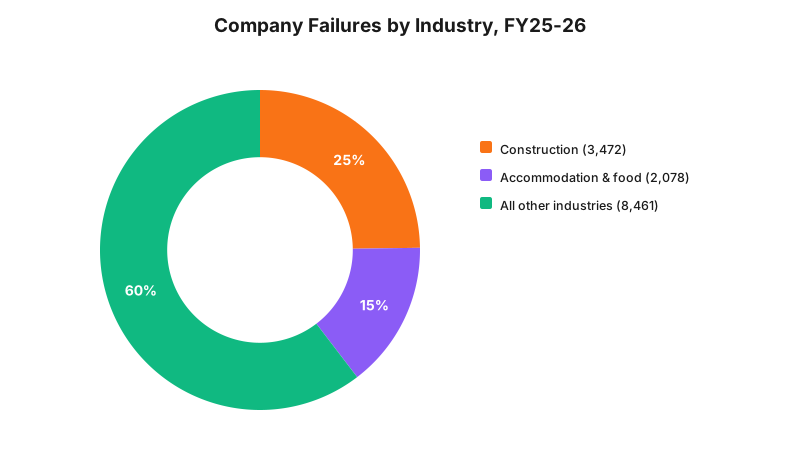
Construction was the single largest source of company failures in FY2025-26, with 3,472 external administrations, roughly a quarter of the national total. Accommodation and food services followed with 2,078, a 16% drop from the 2,476 recorded the year before, but still the second-largest single industry. Together the two accounted for close to 40% of every company failure in the country, out of a national total of 14,011.
| Industry | External administrations, FY2025-26 | Approx. share of total |
|---|---|---|
| Construction | 3,472 | 25% |
| Accommodation and food services | 2,078 | 15% |
| All other industries | 8,461 | 60% |
Both industries share a structural reason for showing up here year after year. Contracts get signed at a fixed price months before the work is done, and costs move against the business in between. Hospitality runs on thin margins and casual, weather-sensitive trade. Neither problem is fixed by a better website, but both are made worse by a slow-moving quoting or booking process that leaves cash sitting uncollected longer than it should.
Takeaway: construction and hospitality together made up close to 40% of every company failure in FY2025-26, a pattern that has held for three straight years.
Why Businesses Actually Fail: Cash Flow, Not Bad Ideas
Ask the ABS why a business exited and you get no answer, the data doesn’t record a reason. Ask small business owners directly, and cash flow comes up first, every time.
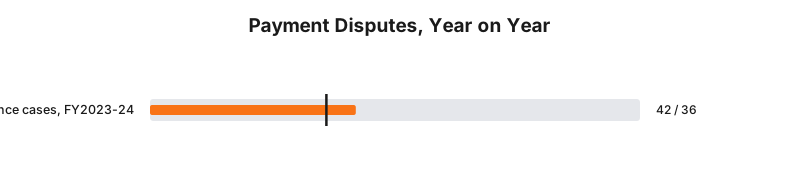
Nearly 80% of Australian small and medium businesses reported an impact to their cash flow in the past 12 months, according to research commissioned by CommBank and conducted by YouGov, published January 2025. Separately, the Australian Small Business and Family Enterprise Ombudsman has flagged payment disputes, invoices going unpaid on time, as an early warning sign of the same problem: payment disputes made up 42% of ASBFEO’s assistance cases in FY2023-24, up from 36% the year before.
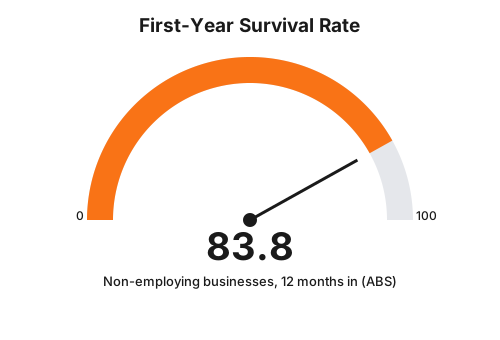
The pattern is consistent across every dataset in this post. A business does not usually fail because the idea was bad or the product didn’t work. It fails because money stopped arriving in time to cover wages, materials, or rent, even when the underlying business was sound. Non-employing businesses, the category most new entrants fall into, had an 83.8% survival rate one year in, per the ABS’s June 2021 to June 2022 entry cohort, and survival rises the more employees a business has. The businesses that don’t make it past that point are disproportionately the ones that ran out of runway before the work they’d already done got paid for.
Takeaway: cash flow, not product quality, is the reason small business owners themselves point to most often when a business goes under.
What This Means If You’re Running a Small Business
None of these numbers say a website fixes a cash flow problem. It doesn’t. What a slow, hard-to-use site does is add friction at exactly the point where friction costs the most, the gap between doing the work and getting paid for it.
A quote form that takes three days to reply to, a booking page that only works on desktop, or a site that doesn’t say clearly what you charge, all push a customer’s decision further out and your invoice further behind it. In an environment where 80% of businesses already report cash flow strain, shaving days off that gap is not a nice-to-have.
If you want a second set of eyes on how your website affects the speed customers move from enquiry to paid job, talk to RockingWeb about a straightforward look at what’s slowing that down.
FAQ
What is Australia’s small business failure rate?
There is no single official “failure rate”. The closest verified figure is the ABS combined churn rate of 30.3% for 2024-25 (16.4% entry rate plus 13.9% exit rate). A narrower, harder measure is ASIC’s insolvency count, 14,722 companies entered external administration in FY2024-25.
Is 30% of Australian businesses failing every year?
No. The 30.3% figure is a combined entry and exit rate, businesses starting up plus businesses closing for any reason, not a failure rate. Many exits are owners retiring, restructuring, or simply not renewing an ABN, not the business going broke.
How many Australian companies go insolvent each year?
14,722 companies entered external administration in FY2024-25, per ASIC data, easing slightly to 14,011 in FY2025-26. Both figures sit well above the pandemic-era low of 4,912 in FY2021-22.
Which industries have the highest business failure rates in Australia?
Construction and accommodation and food services consistently record the highest counts of company insolvencies. In FY2025-26, construction accounted for 3,472 external administrations and accommodation and food services for 2,078, together close to 40% of the national total.
Sources
- Australian Bureau of Statistics, Counts of Australian Businesses, Including Entries and Exits, July 2021-June 2025 (released 16 December 2025)
- ASIC, Annual ASIC insolvency data reveals increase in companies failing
- The Epoch Times, Over 14,000 Australian Companies Enter Administration for Second Straight Year (22 July 2026, citing ASIC data)
- UNSW, 80 per cent of Aussie small businesses experience cash flow challenges (16 January 2025, citing CommBank-commissioned YouGov research)
- Australian Small Business and Family Enterprise Ombudsman, Surge in small businesses worried about being paid (media release, FY2023-24 data, republished by Mirage News; ASBFEO’s own copy of this release is no longer live at its original URL)
Vikas Thakur
Founder of RockingWeb. 16 years building for companies like TPG, iiNet and Monadelphous, now focused on websites and marketing that comply with AHPRA's advertising guidelines and still book patients.