67.24% Bounce Rate: Construction Tops Industry Rankings
Construction websites have the highest bounce rate of any industry at 67.24%, and real estate the lowest at 46.85%, according to Databox's analysis of Google Analytics 4 data from April 2023. This report breaks down bounce rate by industry, what GA4 changed about the definition, and what counts as a healthy number in 2026.
 Vikas Thakur Founder, RockingWeb 9 min read
On this page 9
- Key takeaways
- What Bounce Rate Means in 2026
- Bounce Rate by Industry: The Full Breakdown
- Why Construction and Consulting Sites Bounce So Much
- Time on Page Tells the Rest of the Story
- Where the Australian Data Runs Out
- What Counts as a Bad Bounce Rate in 2026
- What to Check First If Your Bounce Rate Is High
- Sources
Key takeaways
- 67.24% is the highest bounce rate of any industry: construction websites, per Databox’s analysis of Google Analytics 4 data (April 2023)
- 46.85% is the lowest bounce rate: real estate, closely followed by apparel and footwear at 46.97%
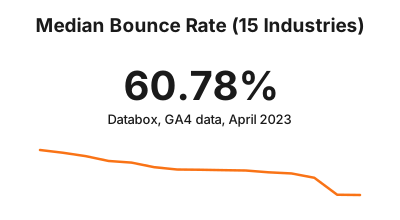
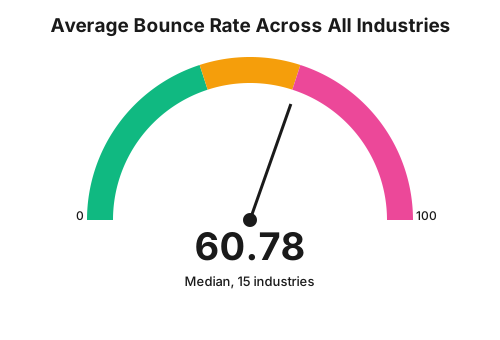
- The median bounce rate across all 15 industries Databox tracks is 60.78%
- SaaS sites bounce at 64.46%, higher than general IT and services at 62.27%
- GA4 counts a session as engaged, not bounced, if it lasts over 10 seconds, fires a key event, or hits two or more page views (Google Analytics Help)
- Universal Analytics stopped processing data on 1 July 2023, so any bounce rate you see from before that date used a stricter, single page view definition
- Median time on page across industries sits at 1 minute 31 seconds, with construction and technology visitors staying longest at 1 minute 46 seconds
The average website bounce rate across 15 industries is 60.78%, according to Databox’s analysis of Google Analytics 4 properties, April 2023 data. Construction sites bounce highest at 67.24%; real estate sites bounce lowest at 46.85%. This is global benchmark data, not an Australia-specific study; no public Australia-only industry breakdown currently exists.
Construction websites lose 67.24% of visitors after a single page, the highest bounce rate of any industry Databox tracks. Real estate sites do the opposite, holding visitors at a 46.85% bounce rate, the lowest in the same dataset. That is a 20 percentage point gap between two industries that both sell high-value, considered purchases. Bounce rate tells you how many people land on a page and leave without going further, and it still shapes how you read your own site’s performance even after the definition changed under GA4. This report pulls together the current bounce rate data by industry, the exact GA4 threshold most site owners get wrong, and where the Australian data runs out. You will see which industries struggle most, what counts as a bad number in 2026, and what to check first if your own bounce rate looks high.
What Bounce Rate Means in 2026
Bounce rate used to have one simple definition: a session where someone viewed a single page and left. Google Analytics 4 changed that, and the change became unavoidable once standard Universal Analytics stopped processing data on 1 July 2023.
GA4 does not count a session as a bounce just because someone viewed one page. It counts a session as engaged, not bounced, if it lasts longer than 10 seconds, fires at least one key event such as a form submit or a purchase, or includes two or more page views. Bounce rate is simply the inverse of engagement rate: whatever share of sessions were not engaged.
This matters for how you read every figure in this report. A bounce rate of 60% under GA4 is not the same visitor behaviour as a bounce rate of 60% under the old Universal Analytics model. If you are comparing a 2026 GA4 number against a bounce rate you saved from 2021, you are not comparing like with like.
Takeaway: any bounce rate benchmark dated before July 2023 was measured under a different rule set. Compare GA4 numbers to GA4 numbers only.
Bounce Rate by Industry: The Full Breakdown
Databox pulls this data from the Google Analytics accounts connected to its platform, covering 15 industries. The most recent published snapshot, from April 2023, puts the median bounce rate across all of them at 60.78%.
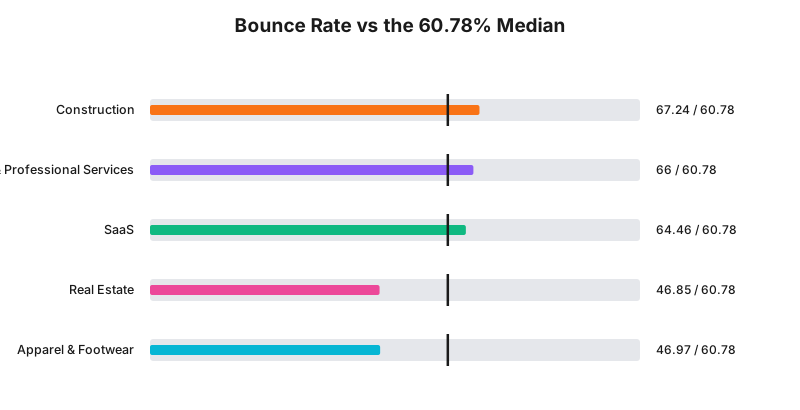
Construction sits at the top of the list at 67.24%, the highest bounce rate of any industry Databox tracks. Consulting and professional services follow close behind at 66%, then SaaS at 64.46%. Real estate sits at the opposite end at 46.85%, just below apparel and footwear at 46.97%.
| Industry | Bounce Rate |
|---|---|
| Construction | 67.24% |
| Consulting & Professional Services | 66% |
| SaaS | 64.46% |
| Information Technology & Services | 62.27% |
| Technology | 61.53% |
| Health & Wellness | 59.44% |
| Industrials & Manufacturing | 58.4% |
| Health Care | 58.29% |
| eCommerce & Marketplaces | 58.11% |
| Education | 57.95% |
| Automotive | 57.13% |
| Food | 56.62% |
| Travel & Leisure | 54.66% |
| Apparel & Footwear | 46.97% |
| Real Estate | 46.85% |
Source: Databox, “Website Traffic Benchmarks by Industry,” April 2023 data.
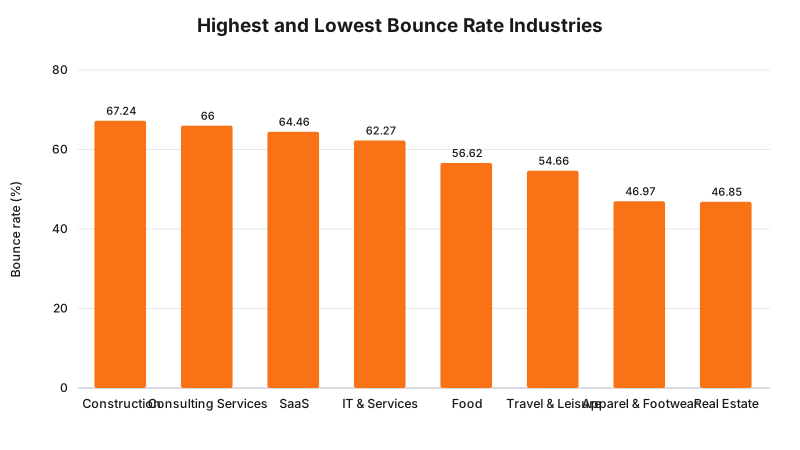
Takeaway: a 20 percentage point gap separates the highest bounce rate industry from the lowest. Where your site sits on that scale depends more on what visitors expect to find than on how good your website is.
Why Construction and Consulting Sites Bounce So Much
A high bounce rate is not automatically a broken website. Construction and consulting sites tend to serve visitors who are still comparing options: a homeowner checking three renovation companies before picking up the phone, or a business owner reading one page of case studies before moving to a competitor’s site to do the same thing. A single page visit that ends in a phone call off site never shows up as a conversion in Google Analytics, even though the visit worked.
Contrast that with real estate. A property listing keeps visitors clicking through photos, floor plans, and nearby listings on the same domain, which naturally produces more page views per session and a lower bounce rate, even when the underlying interest level matches a construction site visitor exactly.
The number alone does not tell you whether a page is working. It tells you how visitors behave once you already know what the page is for.
Takeaway: a high bounce rate on a quote request page and a high bounce rate on a blog post mean two different things. Read the number next to the page type, not on its own.
Time on Page Tells the Rest of the Story
Bounce rate answers one question: did the visitor leave after one page. Time on page answers a different one: how long did they stay before they did.
Databox’s same April 2023 dataset puts the median time on page across industries at 1 minute 31 seconds. Food sites see the shortest visits at 1 minute 8 seconds, typical of menu and location lookups. Construction and technology sites hold visitors longest, both averaging 1 minute 46 seconds.
| Industry | Median Time on Page |
|---|---|
| Construction | 1m 46s |
| Technology | 1m 46s |
| SaaS | 1m 45s |
| Information Technology & Services | 1m 43s |
| Consulting & Professional Services | 1m 36s |
| Real Estate | 1m 34s |
| Education | 1m 28s |
| Health Care | 1m 27s |
| Health & Wellness | 1m 26s |
| Automotive | 1m 25s |
| Industrials & Manufacturing | 1m 23s |
| Food | 1m 8s |
Source: Databox, “Website Traffic Benchmarks by Industry,” April 2023 data.
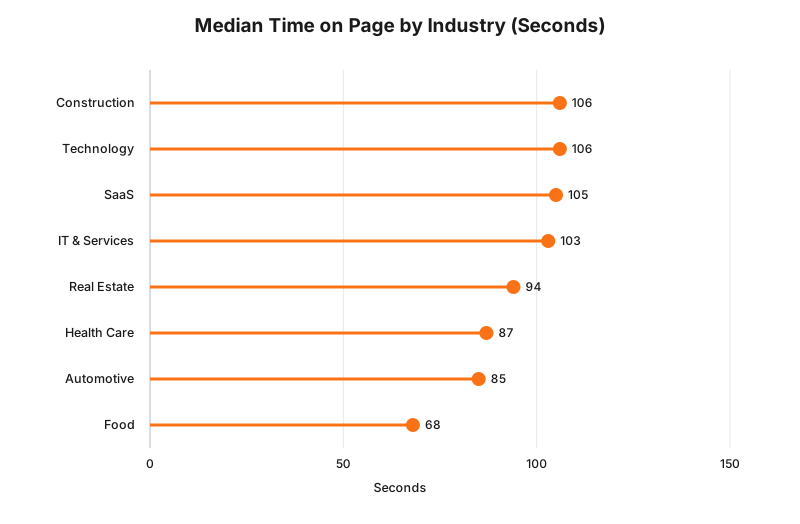
Takeaway: construction has both the highest bounce rate and the longest time on page in this dataset. Visitors who stay, stay to read. The ones who leave, leave fast.
Where the Australian Data Runs Out
None of the bounce rate figures above are Australia specific. Databox’s dataset draws from the Google Analytics accounts connected to its platform, which skews toward US and UK businesses, and no public study currently publishes an Australia-only bounce rate breakdown by industry.
What is verifiable for Australia is the context around it. DataReportal’s Digital 2026 Australia report, drawing on data through late 2025, puts internet penetration at 97.1% of the population, 26.2 million people, on a median mobile connection speed of 122.2 Mbps. Australians are online, and their connections are fast. A high bounce rate on an Australian site is far less likely to be a network problem than it would have been a decade ago.
Until an Australian-specific study exists, the Databox figures above remain the best publicly available benchmark set by industry. Treat them as a global reference point, not a local guarantee.
Takeaway: no Australia-only bounce rate study exists yet. Use the global data as a starting benchmark, then compare your own number against your own site’s history first.
What Counts as a Bad Bounce Rate in 2026
With the median across industries sitting at 60.78%, a rough guide holds up:
- Under 40%: strong engagement, typical of content and product pages people browse for a while
- 40% to 60%: average, in line with most of the industries Databox tracks
- 60% to 70%: worth investigating, especially on pages meant to drive an enquiry
- Above 70%: a page likely losing most visitors before they see your offer
These bands shift depending on page type. A blog post that answers one specific search query will bounce high and still do its job if the visitor found the answer on the page. A quote request page bouncing at 65% is a different problem entirely.
Takeaway: compare your bounce rate to your own industry average first, and to your own page type second. A single number without either comparison tells you almost nothing.
What to Check First If Your Bounce Rate Is High
- Confirm you are reading GA4 data, not comparing it to an old benchmark saved from before the July 2023 Universal Analytics cutover.
- Check page load time. Our own page speed research found 53% of mobile visitors abandon a page that takes longer than three seconds to load, a direct driver of one-page exits.
- Match the page to the visitor’s search intent. A high bounce rate on a page ranking for the wrong keyword usually means the content answers a different question than the one being asked.
- Look at mobile separately from desktop. Bounce rate and load time both tend to run worse on mobile.
- Compare the page against others on your own site before comparing it to an industry average. Internal comparisons catch real problems faster than external benchmarks do.
Takeaway: most high bounce rates trace back to load time, mismatched intent, or a mobile experience nobody tested. Check those three before touching anything else.
If your bounce rate looks high and you are not sure why, that is a diagnosis job, not a guess. See how RockingWeb’s SEO services approach engagement and ranking together, or get in touch for a straight read on what is actually driving people away from your site.
Sources
- Databox. “Website Traffic Benchmarks by Industry.” April 2023 data.
- Google Analytics Help. “Engagement rate.”
- Google Analytics Help. “Universal Analytics sunset timeline.”
- DataReportal. “Digital 2026: Australia.” Data through October 2025.
Note: the Databox dataset draws on global site data, mostly from US and UK businesses connected to its platform, not an Australia-only sample. Where a figure is Australia-specific, this post says so explicitly next to the number.
Vikas Thakur
Founder of RockingWeb. 16 years of experience from working at TPG, iiNet and Monadelphous, now building websites, software and digital marketing for local businesses in Rockingham and Perth.