AI Overviews by Industry: Health Queries Hit 65%+
Health and finance search queries trigger a Google AI Overview more than 65% of the time, the highest rate of any category Otterly.ai tracks, against under 25% for e-commerce product queries. This post breaks down AI Overview coverage by industry using Otterly.ai's 2026 tracking data and Semrush's 10 million-plus keyword study, with the exact source and date behind every figure.
 Vikas Thakur Founder, RockingWeb 8 min read
Key takeaways
- Health and finance search queries trigger a Google AI Overview more than 65% of the time, the highest rate of any category tracked, according to Otterly.ai’s 2026 monitoring data
- E-commerce product queries sit at the opposite end, triggering an AI Overview less than 25% of the time, the same Otterly.ai tracking found
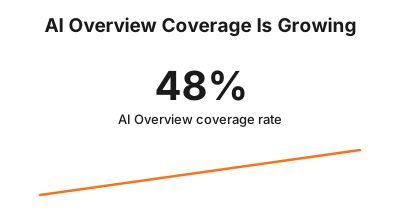
- Across all query types, AI Overviews now appear on 48% of Google searches as of February 2026, up from 31% a year earlier
- Semrush’s study of more than 10 million keywords found AI Overviews covering 25.96% of Science queries in November 2025, the single most saturated category it tracks
- Computers & Electronics (17.92%) and People & Society (17.29%) round out the three most AI Overview-heavy categories in the same Semrush data
- Real Estate, Shopping, and Arts & Entertainment sit at the other end, each under 3% of keywords, Semrush found
- The share of AI Overview queries that are purely informational fell from 91.3% in January 2025 to 57.1% by October 2025, as commercial and transactional searches pushed in
- Food & Drink was the fastest-growing category, up 7.25 percentage points since March 2025
- Brands cited inside an AI Overview earn 35% more organic clicks than brands that are not, per Otterly.ai’s August 2026 tracking
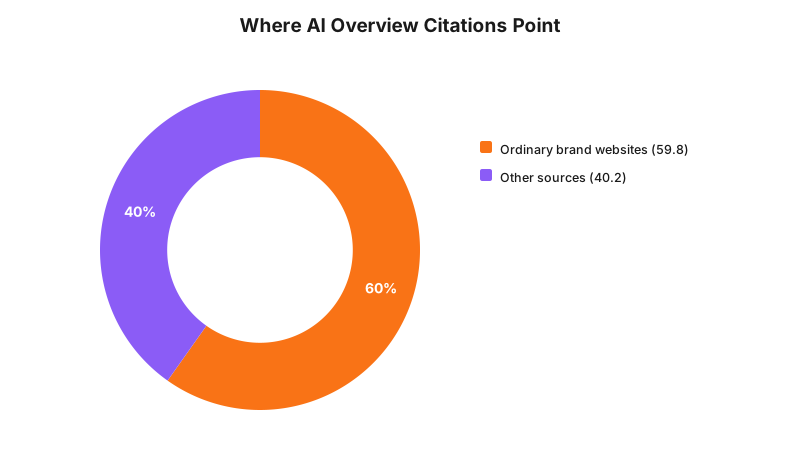
- 59.8% of Google AI Overview citations point to ordinary brand websites rather than Wikipedia or Reddit, according to Otterly.ai’s February 2026 citation study
Health and finance queries trigger a Google AI Overview more than 65% of the time, per Otterly.ai’s 2026 US tracking data. Science queries follow closely, hitting 25.96% coverage in Semrush’s November 2025 study of 10 million-plus US keywords. No Australia-specific industry breakdown exists yet, so these figures reflect US search behaviour.
Health and finance search queries trigger a Google AI Overview more than 65% of the time, the highest rate Otterly.ai has tracked across any industry. E-commerce product searches sit at the opposite end, triggering one less than 25% of the time. That is not a small gap. It means a Perth accountant explaining how tax depreciation works is competing directly with an AI-generated summary on almost every relevant search, while a furniture retailer publishing the same style of content rarely faces one at all. Semrush’s study of more than 10 million keywords backs this up from a different angle: Science, Computers & Electronics, and People & Society are the three most AI Overview-saturated categories, each above 17%, while Real Estate, Shopping, and Arts & Entertainment sit under 3%. This post lays out the coverage rate by industry, where each number comes from, and what the gap means for a business planning content in 2026.
Health and Finance Queries Lead Every Category
Otterly.ai, a tool that tracks brand visibility inside AI Overviews and chatbot answers, publishes a running comparison of trigger rates by query type. Its 2026 update puts health and finance queries at the top: an AI Overview shows up more than 65% of the time someone searches for that kind of information. E-commerce product queries land at the other end of the scale, under 25%.
The gap makes sense once you think about what these queries look like. “What does a raised PSA level mean” or “how does negative gearing work” are the kind of factual, single-answer questions Google’s AI is built to summarise. “Best running shoes for flat feet under $150” is not. It carries brand names, price points, and personal preference that resist a tidy AI summary, so Google leans on the shopping results and product listings it already has instead.
| Query type | AI Overview trigger rate | Source and date |
|---|---|---|
| Health and finance queries | Above 65% | Otterly.ai, February 2026 |
| All query types (average) | 48% | Otterly.ai, February 2026 |
| E-commerce product queries | Below 25% | Otterly.ai, February 2026 |
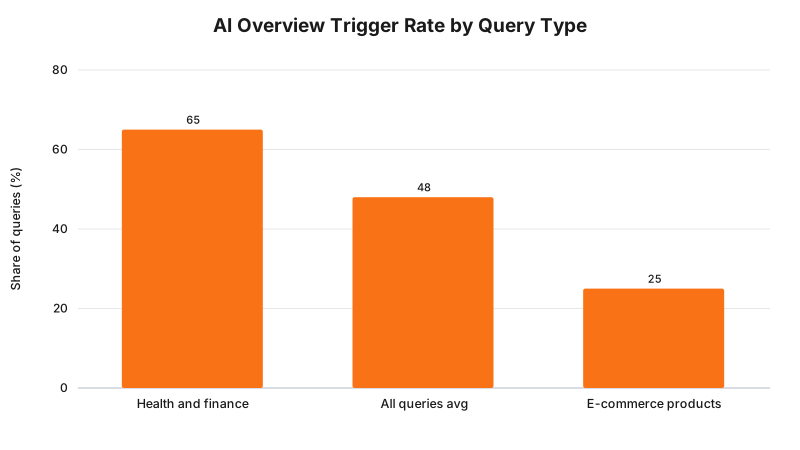
Takeaway: if your business writes content that answers a factual health or money question, expect an AI Overview on almost two out of three searches, roughly triple the rate a product-focused retailer sees.
The Industries Google’s AI Answers Most
Otterly’s category split lines up with a larger, independently run study. Semrush pulled more than 10 million keywords from its own database and tracked 11,000 domains to see how AI Overview coverage moved across industries between January and November 2025. By November, three categories stood out: Science at 25.96% of keywords, Computers & Electronics at 17.92%, and People & Society at 17.29%. All three sit well above the 15.69% average across every category Semrush tracked that month.
Food & Drink was the fastest mover. Its share of AI Overview-triggering keywords climbed 7.25 percentage points since March 2025, pushing it into ninth place on Semrush’s list. Health moved in the opposite direction over the same window: Semrush found Health and People & Society posted the largest drops in AI Overview share of any category it tracks, though the report does not publish an exact percentage for Health on its own.
| Industry | AI Overview coverage | Period |
|---|---|---|
| Science | 25.96% | Semrush, November 2025 |
| Computers & Electronics | 17.92% | Semrush, November 2025 |
| People & Society | 17.29% | Semrush, November 2025 |
| All categories (average) | 15.69% | Semrush, November 2025 |
| Food & Drink | Up 7.25 points since March 2025 | Semrush, November 2025 |
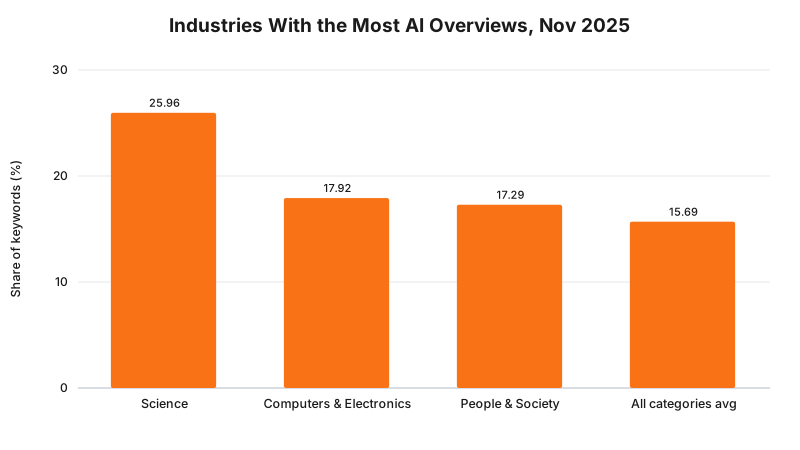
Takeaway: Science, Computers & Electronics, and People & Society each clear 17% coverage, well above the 15.69% category average, and Food & Drink is climbing fastest of all.
Where AI Overviews Barely Show Up
The flip side matters just as much for planning content. Semrush’s same study found Real Estate, Shopping, and Arts & Entertainment sitting under 3% of keywords, the lowest of any tracked category. That lines up with Otterly’s separate finding that e-commerce product queries trigger an AI Overview less than 25% of the time, well under the 48% average across all query types.
A business selling a physical product or a one-off service like a house sale is less likely to see its content competing with an AI-generated summary at the top of the page. The trade-off is that these categories are also the ones Google routes toward shopping results, maps, and paid ads instead, so the click is not necessarily easier to win. It is a different fight, not a smaller one.
Takeaway: Real Estate, Shopping, and Arts & Entertainment queries trigger an AI Overview on fewer than 3% of searches, but that traffic still has to compete with shopping panels and ads rather than a summary box.
Why Query Intent Explains the Industry Gap
The industry split traces back to what people are asking. Semrush tagged every AI Overview-triggering query by intent and found 91.3% were purely informational back in January 2025. By October 2025, that share had fallen to 57.1%, as commercial and transactional searches started triggering AI Overviews more often too. Navigational searches, the kind where someone is typing a brand name to find a specific page, went from barely showing up at 0.74% of AI Overview queries in January to 10.33% by October.
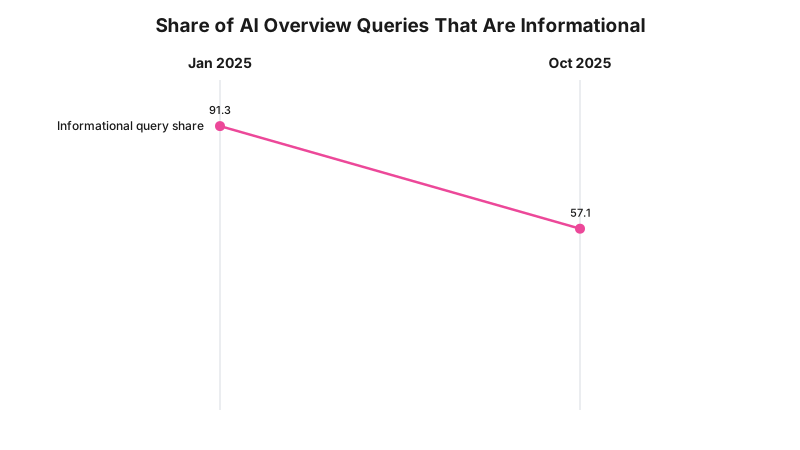
Health and finance questions are disproportionately informational: people ask them to understand something, not to buy something on the spot. That is the likely reason those two categories sit above every other query type in Otterly’s tracking, and it is also why Google keeps expanding AI Overviews into commercial and navigational territory as the feature matures. The categories with the least room to gain are the ones that were already saturated with informational queries a year ago.
Takeaway: AI Overview coverage grew fastest in commercial and navigational searches through 2025, closing some of the gap with health and finance, but informational query types still dominate which industries see the most coverage.
What the Shift Means for Businesses in 2026
None of this means a business should stop writing informational content. It means the content has to earn a spot inside the summary Google generates, not just rank below it. Otterly.ai’s August 2026 tracking found that brands cited inside an AI Overview earn 35% more organic clicks than brands that are not, and its February 2026 citation study found 59.8% of AI Overview citations point to ordinary brand websites rather than Wikipedia or Reddit, the sources ChatGPT and Perplexity lean on instead.
That is a fixable problem, not a fixed outcome. Checking whether a site’s own content earns citations, and where it is losing clicks to an AI Overview, starts with the same data Google Search Console already tracks. RockingWeb’s free SEO audit reviews that data against the patterns in this post and flags which pages are worth fixing first.
Takeaway: getting cited inside an AI Overview earns more clicks than the summary costs you, so the priority is fixing the pages losing ground, not avoiding informational content altogether.
The Data at a Glance
| Metric | Figure | Source and date |
|---|---|---|
| Health and finance query trigger rate | Above 65% | Otterly.ai, February 2026 |
| E-commerce product query trigger rate | Below 25% | Otterly.ai, February 2026 |
| All queries, AI Overview coverage | 48% (up from 31% a year earlier) | Otterly.ai, February 2026 |
| Most saturated industry | Science, 25.96% | Semrush, November 2025 |
| Second and third most saturated | Computers & Electronics 17.92%, People & Society 17.29% | Semrush, November 2025 |
| Least saturated industries | Real Estate, Shopping, Arts & Entertainment, all under 3% | Semrush, November 2025 |
| Fastest-growing industry | Food & Drink, up 7.25 points since March 2025 | Semrush, November 2025 |
| Informational share of AI Overview queries | 91.3% (Jan 2025) down to 57.1% (Oct 2025) | Semrush |
| Organic click lift for brands cited in an AI Overview | 35% more clicks than uncited brands | Otterly.ai, August 2026 |
| Citations pointing to ordinary brand websites | 59.8% (vs. Wikipedia and Reddit for ChatGPT and Perplexity) | Otterly.ai, February 2026 |
These figures come from two different tracking methodologies, Otterly’s live monitoring and Semrush’s 10 million-plus keyword database, and neither publishes an Australia-specific industry breakdown yet. Both point the same direction: informational, fact-heavy categories like health, finance, and science see an AI Overview far more often than shopping and real estate do, and that gap is a bigger factor in a page’s exposure than the overall 48% average suggests on its own.
Vikas Thakur
Founder of RockingWeb. 16 years of experience from working at TPG, iiNet and Monadelphous, now building websites, software and digital marketing for local businesses in Rockingham and Perth.