Slow Main Content? Fix LCP by Its 4 Parts
Largest Contentful Paint should land within 2.5 seconds. web.dev splits it into four parts, with about 40% on the server response and about 40% on loading the main image or text, so fixes are easy to rank. Here is the order to work in.
 Vikas Thakur Founder, RockingWeb 4 min read
Key takeaways
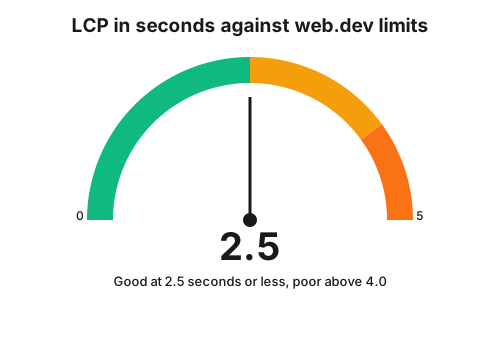
- A good LCP is 2.5 seconds or less, and poor is above 4.0 seconds
- web.dev’s guide splits LCP into 4 parts: about 40% server response, under 10% load delay, about 40% load duration, under 10% render delay
- LCP counts from the moment a visitor starts to navigate, so redirects and server time count too
- web.dev says to start with just 2 requests: the HTML document and the LCP resource
- Large JavaScript files can hold up an image that has already downloaded
According to web.dev, a good Largest Contentful Paint is 2.5 seconds or less, and a well-optimised page spends about 40% of that on the server response and about 40% on loading the main image or text.
LCP is the moment your biggest visible thing finishes drawing. On a local business site that is usually a hero photo or a headline. If it is slow, a visitor in Mandurah on a phone sees a blank screen and leaves. This guide shows you where the time goes and what to fix first.
What LCP counts
web.dev says LCP reports the render time of the largest image, text block or video visible in the viewport, relative to when the user first navigated to the page. It also says LCP includes unload time from the previous page, connection set-up, redirect time and Time To First Byte delays.
So a slow server hurts LCP before your image even starts.
The four parts
web.dev gives these shares as a guideline for a well-optimised page.
| LCP part | Share of LCP | What it means |
|---|---|---|
| Time to first byte | About 40% | Server and network start-up |
| Resource load delay | Under 10% | Time before the browser starts loading the main image |
| Resource load duration | About 40% | Time to download the main image or text resource |
| Element render delay | Under 10% | Time between download and drawing on screen |
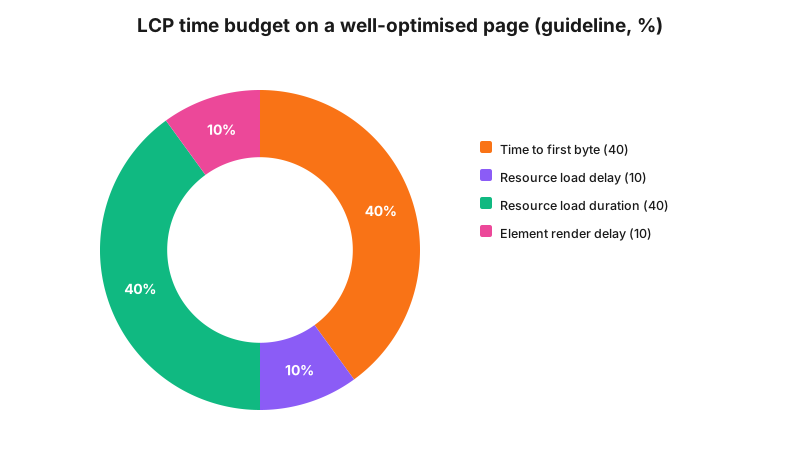
The two “delay” parts are shown at 10% for the chart, because web.dev gives them as “under 10%”. web.dev adds that these are guidelines, not strict rules, and that if your LCP is consistently within 2.5 seconds the proportions matter less.
Takeaway: the two “delay” parts should be close to zero. Chase them first.
Where to start
web.dev says to look at just two requests: the initial HTML document and the LCP resource. The times when the LCP resource starts and ends show whether the page is tuned for LCP. You can find the LCP element in PageSpeed Insights, Chrome DevTools or WebPageTest, then match it to the network waterfall.
Work in this order:
- Server response. If the HTML itself arrives late, nothing else helps.
- Load delay. Make sure the browser can find your main image early, not after a script runs.
- Load duration. Send an image sized for the screen, not the original camera file.
- Render delay. Remove or break up scripts that block drawing.
When scripts get in the way
web.dev says the most common reason for element render delay is large JavaScript files that must be parsed and executed on the main thread. Browsers render images on the main thread, so anything blocking it can delay the image even after it has fully downloaded. Its advice is to break up long tasks.
If your site loads chat widgets, tracking tags and sliders above the main image, ask which ones you really use.
Frequently Asked Questions
What is a good LCP score?
web.dev says sites should strive for a Largest Contentful Paint of 2.5 seconds or less, measured at the 75th percentile of page loads, segmented across mobile and desktop. Values above 4.0 seconds are poor.
What does LCP measure?
The render time of the largest image, text block or video visible in the viewport, relative to when the user first navigated to the page. It includes server delay and redirects, not just image download time.
How is LCP time split up?
web.dev gives four parts as a guide for a well-optimised page. Time to first byte is about 40%, resource load delay is under 10%, resource load duration is about 40%, and element render delay is under 10%.
Can JavaScript slow my main image even after it downloads?
Yes. web.dev says browsers render images on the main thread, so a large script that runs first can delay the render even when the image has fully downloaded.
Want a hand?
If your main image or headline feels slow, we can trace which of the four parts is eating the time. See web design in Rockingham or web design in Baldivis, then contact us. For the other two metrics, read our Core Web Vitals pass marks.
Sources
web.dev, Largest Contentful Paint
. Source of the definition, the 2.5 and 4.0 second marks and what LCP includes. Read 3 November 2026.web.dev, Optimize Largest Contentful Paint
. Source of the four-part breakdown, the two-request method and the long-task advice. Read 3 November 2026.
Last reviewed: 3 November 2026.
Vikas Thakur
Founder of RockingWeb. 16 years of experience from working at TPG, iiNet and Monadelphous, now building websites, software and digital marketing for local businesses in Rockingham and Perth.