Why Clinic Websites Load Slowly, Ranked by Likelihood
A slow clinic homepage is rarely one problem, it is four stacked in a specific order. Google's Core Web Vitals model shows which layer to fix first, and where clinic sites (heavy hero images, embedded booking widgets, tracking scripts) typically lose the most time.
 Vikas Thakur Founder, RockingWeb 12 min read
Key takeaways
- Google’s Largest Contentful Paint (LCP) “good” threshold is 2.5 seconds, measured at the 75th percentile of real visits, per Google’s web.dev Core Web Vitals documentation
- Interaction to Next Paint (INP) must sit at 200 milliseconds or less; Cumulative Layout Shift (CLS) at 0.1 or less
- Google splits LCP into four stages: roughly 40% Time to First Byte, under 10% resource load delay, roughly 40% resource load duration, under 10% element render delay
- On a typical clinic homepage, an unoptimised hero photo or before and after image is the most common LCP bottleneck
- A slow-loading booking widget (Cliniko, Nookal, Zenoti, Fresha) is the most common INP culprit, because its script blocks the main thread while the page settles
- INP replaced First Input Delay as the third official Core Web Vital in 2024 and, with LCP and CLS, carries Stable status as of the web.dev documentation checked on 15 August 2026
- No infringement notice or regulator penalty attaches to a failing Core Web Vitals score; the consequence is competitive, not punitive
A clinic homepage that takes eight seconds to show its hero photo is not failing for one reason. It is failing for up to four separate reasons, stacked in a specific, measurable order, and Google names all four in its own Core Web Vitals documentation, current as checked on 15 August 2026. Two of those four typically account for roughly 80% of the load-time budget between them: how long the server takes to respond, and how long the page’s biggest visible element takes to load. Fix those two first, and the smaller two usually shrink on their own.
This matters for a clinic site specifically because the pattern repeats with almost no variation: a large hero image or before and after photo, a booking widget bolted on from a separate vendor, and a stack of tracking scripts sitting on top. Below is the order Google’s own model says to fix them in, what each fix looks like in the build, and where the honest limits sit.
What Google Says
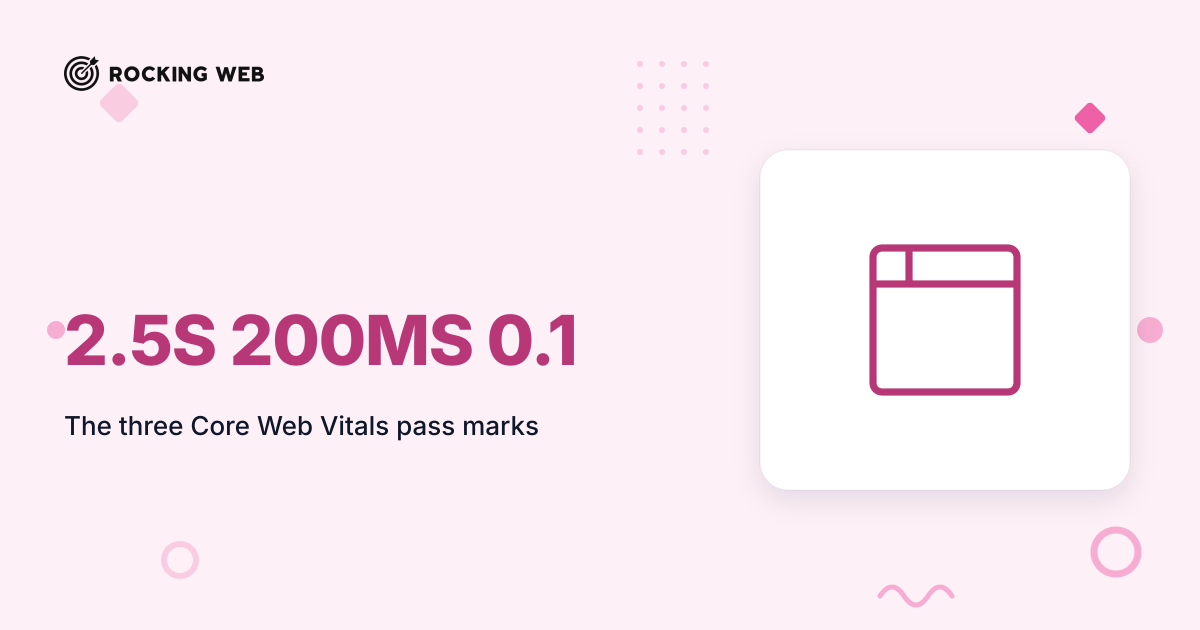
Google’s Core Web Vitals are three measured metrics: Largest Contentful Paint, Interaction to Next Paint, and Cumulative Layout Shift. According to Google’s web.dev Core Web Vitals overview, a page passes the “good” threshold for each when, at the 75th percentile of page loads across both mobile and desktop:
- LCP occurs within 2.5 seconds of the page starting to load
- INP is 200 milliseconds or less
- CLS is 0.1 or less
All three metrics carry Stable lifecycle status as of the version of that page checked on 15 August 2026. INP replaced First Input Delay as the third Core Web Vital in 2024, which matters if any older audit tool or agency report you’re holding still references FID; that metric is retired.
The more useful detail sits inside Google’s LCP optimisation guide, which splits the 2.5-second LCP budget into four named stages: Time to First Byte (roughly 40% of the time), resource load delay (under 10%), resource load duration (roughly 40%), and element render delay (under 10%). Two stages, TTFB and resource load duration, do almost all the damage. That is the order-of-likelihood signal this whole post is built on.
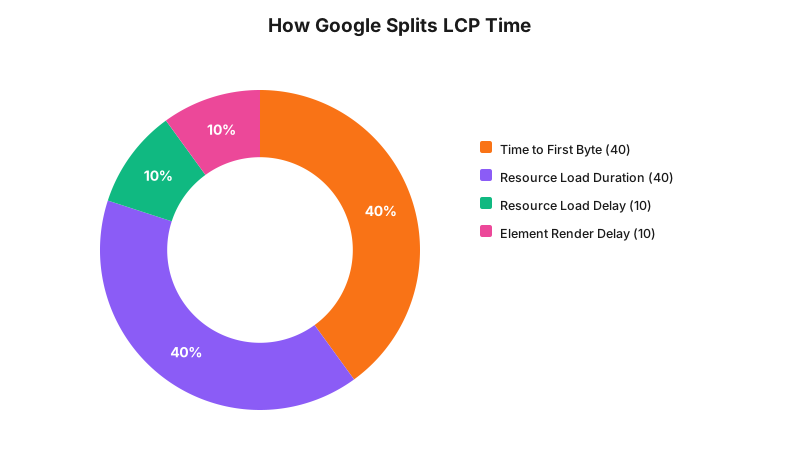
Takeaway: two of Google’s four LCP stages (server response and the load time of the biggest element) eat about 80% of the budget, so that’s where a fix pays off fastest.
What That Means for the Build
Each stage above maps to specific, checkable things in a clinic site’s code. Here is what to look at, layer by layer.
Server response (TTFB). On shared hosting with no CDN, every visitor’s first byte travels further and waits longer behind other sites on the same box. The fix is a CDN-backed host, server-side caching (page cache for WordPress builds, edge caching for anything static), and cutting redirect chains. A domain that 301s twice before landing on the real URL adds a full round trip before the browser has even started downloading the page.
Resource load duration (the LCP element itself). For most clinic homepages the LCP element is the hero image, sometimes a before and after photo above the fold. If it’s served at its original camera resolution (often 3,000 to 4,000 pixels wide) and only displayed at 1,200 pixels, the browser is downloading three or four times more data than it needs. The fix: resize to the actual display width, serve WebP or AVIF instead of JPEG or PNG, and set fetchpriority="high" on the <img> tag so the browser prioritises it over less important assets. Never lazy-load the LCP image; a loading="lazy" attribute on the hero image tells the browser to wait, which is the opposite of what you want for the one image Google is timing.
Resource load delay. This stage grows when the LCP resource isn’t discoverable straight away, commonly because it’s loaded via a CSS background-image rule instead of an <img> tag, or injected by JavaScript after the initial HTML parses. Put the hero image in the HTML markup itself, not in a stylesheet or a script.
Element render delay and Interaction to Next Paint. This is where third-party scripts do the damage. A booking widget (Cliniko, Nookal, Zenoti, Fresha, Pabau) that loads synchronously in the <head> blocks the main thread while its JavaScript downloads, parses, and runs, which delays both first render and every click a visitor makes for the first second or two. Per Google’s INP optimisation guide, the main culprits are long tasks blocking the main thread, heavy script evaluation, and large DOM sizes. The fix is loading the booking widget with async or defer, or delaying it until the visitor scrolls near the booking section, plus auditing the tag manager container for duplicate GA4, Meta Pixel, or ad-platform tags firing on every page load.
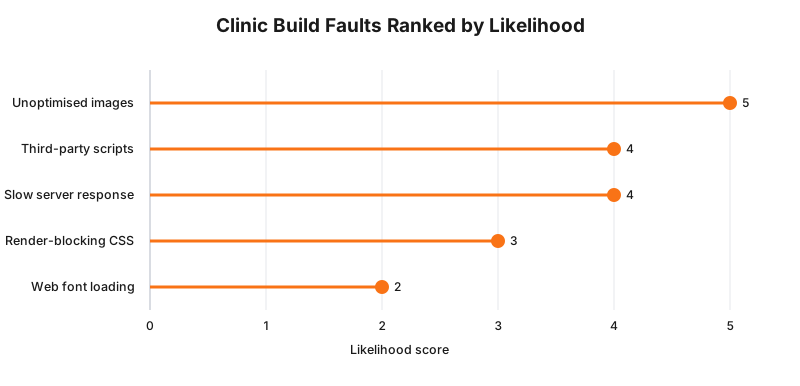
The ranking above is RockingWeb’s build-assessment framework, informed by Google’s own LCP and INP breakdowns, not a measured frequency study of Australian clinic sites.
Takeaway: the two heaviest LCP stages map directly to two build decisions: how the hero image is served, and whether the server responds fast. Everything else is a smaller, later fix.
Order of Likelihood: A Decision Matrix
| Build layer | Metric it hits | Typical clinic-site culprit | Fix |
|---|---|---|---|
| Unoptimised images | LCP | Full-resolution hero photo or before/after image served unresized | Resize, compress, serve WebP/AVIF, set fetchpriority="high" |
| Third-party scripts | INP | Booking widget loading synchronously, plus GA4/GTM/Meta Pixel duplicates | Load widgets async/deferred, audit the tag manager container |
| Slow server response | LCP | Shared hosting, no CDN, uncached PHP build, redirect chains | CDN-backed host, page/edge caching, remove redirect hops |
| Render-blocking CSS | LCP | Full theme stylesheet or page-builder CSS loaded before first paint | Inline critical CSS, defer the rest, strip unused builder CSS |
| Web font loading | CLS, LCP | Custom Google Fonts loaded with no font-display, causing layout shift | Self-host fonts, set font-display: swap, define fallback metrics |
This table is ordered most likely to least likely, based on how the four LCP stages above are weighted and on which layer of a typical clinic build sits inside each stage.
A Worked Example
Cosmetic clinic. A clinic’s homepage carried a 4.8MB hero photo of the reception area, served at its original camera resolution and set as a CSS background-image rather than an <img> tag. The booking widget script sat in the <head>, loading before any visible content. Lighthouse flagged the hero photo as the LCP element with a resource load duration of over three seconds on its own. The fix moved the photo into the HTML as a compressed, resized <img> with fetchpriority="high", and moved the booking widget to load after the hero section rendered. Nothing else on the page changed.
Cosmetic dentistry practice. A dental practice’s site loaded four separate tracking scripts (Google Analytics via GTM, Meta Pixel, a call-tracking script, and a chat widget) all synchronously in the page head, ahead of any content. The homepage passed LCP comfortably because the hero image was already reasonably sized, but INP failed on mobile because clicking any navigation link during the first two seconds queued behind four scripts still parsing. The fix deferred the chat widget and call-tracking script until after first paint and moved GTM to load asynchronously, leaving Meta Pixel as the only script still competing for the main thread on load.
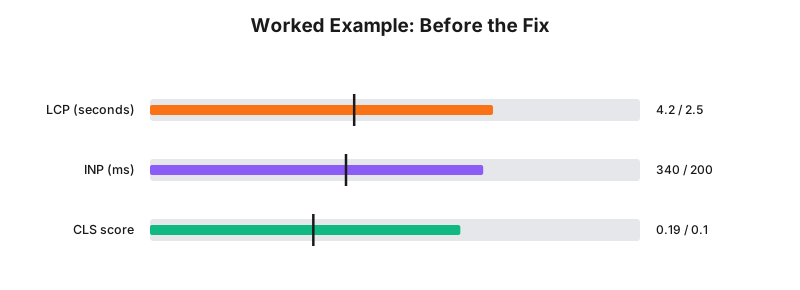
The numbers above are illustrative, representing a common pattern in unoptimised clinic homepages, not a measured result from an audit.
Takeaway: the same four-stage model applies whether the visible symptom is a slow LCP or a laggy click, because both trace back to what’s blocking the main thread and what’s downloading first.
What to Check on Your Own Site
- Run Chrome DevTools’ Lighthouse panel (or Google Search Console’s Core Web Vitals report for real-world field data) and note which metric fails.
- In the Lighthouse or Performance panel, identify the actual LCP element. Is it the hero image, a heading styled with a webfont, or a CSS background image?
- Check whether the LCP image has
fetchpriority="high"and noloading="lazy"attribute. - Check whether your booking widget script tag has
asyncordefer, or loads without either. - Open your tag manager container and count how many analytics or pixel tags fire on every page load, including duplicates left over from a previous agency.
- Check Time to First Byte in the Network panel; above roughly 600 milliseconds on a repeat visit points to a hosting or caching problem, not a front-end one.
- Check whether custom fonts are self-hosted with
font-display: swap, or loaded from a third party with nopreconnecthint. - Watch the Performance panel for layout shift caused by a chat widget, cookie banner, or ad slot that loads in after the page has already rendered.
The Enforcement Anchor
There is no infringement notice, penalty, or regulator determination attached to Core Web Vitals, because none applies. This is not a compliance rule enforced by a government body; it’s Google’s own measurement framework, published as guidance rather than law. The closest thing to teeth is competitive rather than punitive: Google has built Core Web Vitals into how it evaluates a page’s real-world experience in Search, and a site that fails all three thresholds is working against its own visibility, not risking a fine. Most of RockingWeb’s organic content on regulator enforcement cites a real notice or determination; for this post, the honest answer is that no such action exists to cite, and it would misrepresent how this works to invent one.
Where This Gets Hard
Field data (the numbers Google uses, sourced from real Chrome users through the Chrome UX Report) rolls on a 28-day window. A fix shipped today can look perfect in a lab test tomorrow and still show as failing in Search Console for weeks, because the field data hasn’t caught up. Don’t judge a fix by an instant lab score alone.
Booking widgets are also often outside a clinic’s direct control. The widget’s own script, its own third-party requests, and its own render behaviour belong to the vendor, not the clinic’s codebase. A clinic can choose when and how the widget loads on the page, but not rebuild what happens inside it. Where a vendor’s own script is the bottleneck, the practical fix is deferred loading and vendor-side conversations, not a front-end rewrite that has nothing left to touch.
Fixing one metric can also nudge another. Self-hosting fonts to remove a third-party font request can improve LCP and CLS together, but only if the self-hosted files are cached correctly; done badly, it just moves the same delay onto your own server instead of Google’s.
Status
In effect. Google has treated Core Web Vitals as a live measurement standard since 2020, with Interaction to Next Paint replacing First Input Delay as the third official metric in 2024. All three metrics, LCP, INP and CLS, carry Stable status as of the web.dev documentation checked on 15 August 2026. This is not a proposal and not pending commencement; it is Google’s current, in-use standard.
Frequently Asked Questions
What is the single biggest cause of a slow clinic website?
Per Google’s own Core Web Vitals breakdown, Time to First Byte and the load time of the page’s largest visible element together account for roughly 80% of a page’s Largest Contentful Paint budget. On most clinic sites that largest element is an unresized hero photo or before and after image, which makes unoptimised images the most common single bottleneck.
Does a slow booking widget affect Google rankings?
Indirectly, yes. Google’s Interaction to Next Paint metric measures how long a page takes to respond to a click or tap, and a booking widget script that blocks the main thread while it loads is a common cause of a poor INP score. Google groups LCP, INP and CLS together as Core Web Vitals, the metrics it names among the signals it factors into how a page’s experience is evaluated in Search.
How fast should a clinic website load to pass Core Web Vitals?
To meet Google’s “good” thresholds a page needs a Largest Contentful Paint of 2.5 seconds or less, an Interaction to Next Paint of 200 milliseconds or less, and a Cumulative Layout Shift score of 0.1 or less, each measured at the 75th percentile of real visits across both mobile and desktop.
Get Your Clinic Site’s Speed Checked
Get in touch and RockingWeb will run your site through the same four-stage breakdown, tell you which layer is costing you time, and give you a fix order, not just a score.
For a deeper look at how heavy Australian cosmetic clinic homepages typically run, see our benchmark of 21 real clinic homepages. For a full rebuild, see our work on cosmetic clinic websites built fast from the first line of code.
Sources
- web.dev (Google) - Core Web Vitals and web performance guidance hub. Checked 15 August 2026.
- web.dev (Google) - Core Web Vitals overview and thresholds. Checked 15 August 2026.
- web.dev (Google) - Optimize LCP, the four-stage breakdown. Checked 15 August 2026.
- web.dev (Google) - Optimize INP, causes and fixes. Checked 15 August 2026.
Last reviewed: 15 August 2026.
Vikas Thakur
Founder of RockingWeb. 16 years of experience from working at TPG, iiNet and Monadelphous, now building websites, software and digital marketing for local businesses in Rockingham and Perth.