4.3% Conversion Rate: Dental Website Benchmark (2024)
Dental landing pages convert at a median of 4.3%, the lowest of any healthcare subcategory measured in Unbounce's 2024 Conversion Benchmark Report, which analysed over 57 million conversions. No Australian-specific dataset breaks out this figure for dental or cosmetic clinic websites, so here is the closest verified benchmark and what it means for a practice's booking flow.
 Vikas Thakur Founder, RockingWeb 8 min read
On this page 9
- Key Takeaways
- Why There Is No Australian Benchmark for This
- Dental Sits Lowest of Any Healthcare Subcategory
- Which Channel Actually Converts
- Desktop Still Wins, and Reading Level Matters More Than You’d Think
- What This Means for a Cosmetic Dentistry Website
- FAQ
- Get Your Practice’s Website Benchmarked
- Sources and References
Key Takeaways
- Dental landing pages convert at a 4.3% median, the lowest of any healthcare subcategory in Unbounce’s 2024 Conversion Benchmark Report
- Half of all dental pages measured convert between 2% and 8.3%, a wide spread across the same category
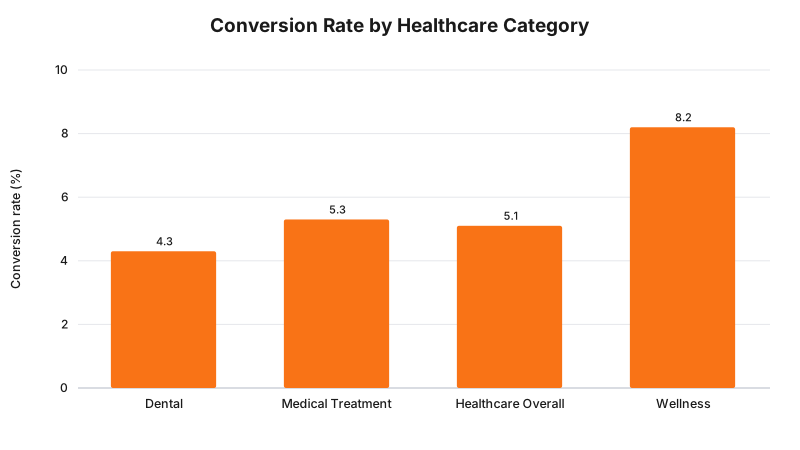
- The broader healthcare and wellness category median sits at 5.1%, with medical treatment pages at 5.3% and wellness pages leading at 8.2%
- The report analysed more than 57 million conversions across 41,000+ landing pages and 464 million unique visitors
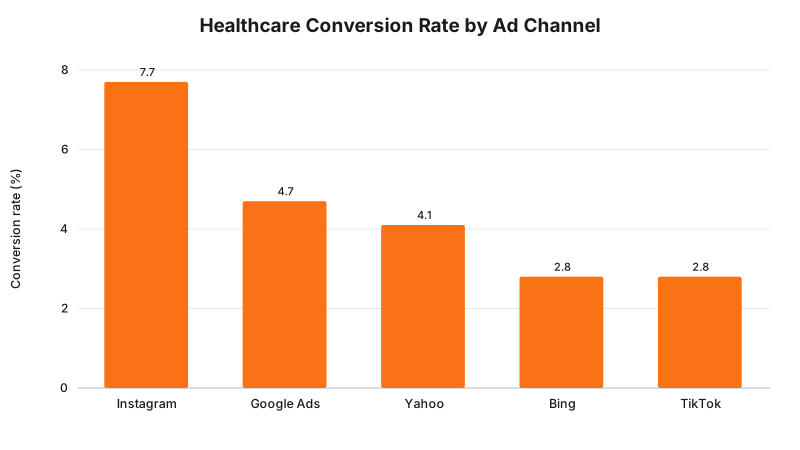
- Google Ads paid search traffic converts at a median of 4.7% on healthcare pages, ahead of Yahoo’s 4.1% and Bing’s 2.8%
- Instagram paid social converts at a median of 7.7%, with top-performing pages reaching 39.7%
- Desktop visitors convert 22% better than mobile, despite mobile driving 7 times more traffic to healthcare pages
- Pages written at a 5th to 7th grade reading level convert at 10.8%, while 10th to 12th grade copy converts 55.6% lower
- No Australian-specific public dataset breaks out dental or clinic website conversion rates. This global figure is the closest verified benchmark available
Dental landing pages convert at a median of 4.3%, the lowest rate of any healthcare subcategory measured. That comes from Unbounce’s 2024 Conversion Benchmark Report, built from more than 57 million tracked conversions across 41,000-plus landing pages. No Australian body publishes an equivalent figure specifically for dental or cosmetic clinic websites, so this global number is the closest verified benchmark available in 2026.
Half of the dental pages in that dataset convert somewhere between 2% and 8.3%, which is a wide enough spread to make a single “good” number close to meaningless on its own. What matters more for a practice website is where the visitors who don’t convert are dropping off, and what the data says about the channels, devices, and copy that move that number.
This post breaks down every figure behind the 4.3%, then covers what it means for a cosmetic dentistry website’s booking flow and the AHPRA rules that shape what a practice can say while trying to close that gap.
Why There Is No Australian Benchmark for This
Search for an Australian-specific conversion rate benchmark for dental or cosmetic clinic websites and you will not find one. The Australian Dental Association’s fee surveys track pricing, not website performance. AHPRA’s registrant data tracks practitioner numbers and complaints, not booking rates. IBISWorld’s dental services reports cover revenue and market size, not conversion.
That gap is worth stating plainly rather than filling with an invented number. The most current, named figure available anywhere is Unbounce’s 2024 Conversion Benchmark Report: 41,000-plus landing pages, 464 million unique visitors, 57 million conversions. It is not Australian data, but it is large, recent, and transparent about its sample size, which puts it ahead of the alternatives.
Takeaway: treat the figures below as the best available global proxy for a dental or cosmetic clinic website, not as an Australian-specific number.
Dental Sits Lowest of Any Healthcare Subcategory
Unbounce breaks its healthcare and wellness category into subcategories. Dental sits at the bottom.
| Subcategory | Median Conversion Rate | Typical Range |
|---|---|---|
| Wellness | 8.2% | 4.5% to 14.5% |
| Medical treatment | 5.3% | Not stated |
| Dental | 4.3% | 2% to 8.3% |
| Healthcare & wellness (all) | 5.1% | Not stated |
Wellness pages, which the report notes as the standout performer, convert at nearly double the dental median. Medical treatment pages sit closer to the category average. Dental is the outlier on the low side.
The report does not explain why dental lags. A reasonable digital explanation is that dental procedures, particularly cosmetic ones like veneers, carry a higher price point and more required research than a single wellness consultation, so a first-time visitor is less likely to book on the first visit. That is inference, not a finding in the source data.
Takeaway: if your practice’s website converts anywhere in the 2% to 8.3% range, it is inside the normal spread for dental. Below 2% signals a genuine problem worth investigating.
Which Channel Actually Converts
Not every visitor is equal. The channel that brought them in changes what “good” looks like.
| Channel | Median Conversion Rate | Notes |
|---|---|---|
| Instagram (paid social) | 7.7% | Top pages reach 39.7% |
| Google Ads (paid search) | 4.7% | Not stated |
| Yahoo (paid search) | 4.1% | Not stated |
| Bing (paid search) | 2.8% | Not stated |
| TikTok (paid social) | 2.8% | Top pages reach 12.6% |
The report also states that email traffic to health and wellness pages converts at nearly double the rate of both paid search and paid social, though it does not give an exact percentage for email on its own. If your practice runs any kind of recall or referral email list, that is a channel worth protecting rather than treating as an afterthought behind paid ads.
Takeaway: a Google Ads campaign converting below 4.7% is underperforming the healthcare median for that channel specifically, not just the category average.
Desktop Still Wins, and Reading Level Matters More Than You’d Think
Two more findings from the same report are directly relevant to how a clinic’s own site is built.
Desktop visitors convert 22% better than mobile visitors on healthcare and wellness pages, even though mobile drives seven times more traffic. That gap between traffic share and conversion share is the clearest sign of a mobile experience that isn’t carrying its weight, whether that’s a booking form that’s awkward on a small screen or a page that loads too slowly.
Copy reading level matters just as much. Pages written at a 5th to 7th grade reading level convert at a median of 10.8%, more than double the overall healthcare median. An 8th to 9th grade level converts 48% lower than that optimal band, and a 10th to 12th grade level converts 55.6% lower. The report’s recommended range sits between 355 and 1,020 words per page.
Takeaway: a mobile-unfriendly booking flow and dense, clinical-sounding copy are both measurable conversion costs, not just style preferences.
What This Means for a Cosmetic Dentistry Website
None of the figures above tell a practice what it’s legally allowed to publish. That’s a separate question governed by AHPRA’s advertising rules, which apply to cosmetic dentistry the same way they apply to cosmetic medicine. Check what you can say before rewriting a page to chase a better reading-level score or a shorter booking form. Our breakdown of the current AHPRA advertising rules for cosmetic dentistry covers that in full, and RockingWeb can flag specific pages against the current rules before you invest in a rebuild.
Inside those rules, three things move the numbers above without touching anything AHPRA regulates:
- Shorten the path to a booking form. Every extra field between “I’m interested” and “I’ve requested a consultation” is a place a mobile visitor abandons, and mobile is carrying most of your traffic while converting worst.
- Write for a 5th to 7th grade reading level. This is a copy decision, not a clinical one. Explaining a procedure simply is not the same as making an outcome claim.
- Show a price range, not silence. A visitor who has no sense of cost before enquiring is more likely to abandon a form than one who knows roughly what to expect, purely as a friction question rather than a pricing policy one.
A compliant, conversion-built cosmetic clinic website applies all three without crossing into claims AHPRA restricts.
Takeaway: the conversion levers in this report and the compliance rules that govern cosmetic dentistry advertising are two separate systems. Fix both, in that order, rules first.
FAQ
What is a good conversion rate for a dental or cosmetic clinic website?
There is no published Australian-specific benchmark for dental or cosmetic clinic websites. The closest verified figure is Unbounce’s 2024 Conversion Benchmark Report, which puts the global median for dental landing pages at 4.3%, with half of all dental pages converting between 2% and 8.3%. Use that range as a starting point, not a target, since it covers all countries and traffic sources combined.
Why do dental websites convert lower than other healthcare categories?
Unbounce’s report does not give a reason. It does show that dental sits below wellness (8.2% median) and medical treatment (5.3% median) inside the same 5.1% healthcare and wellness category average. A plausible digital explanation is that dental procedures are higher cost, more discretionary, and involve more research before a visitor commits to a booking form, but that is inference, not something the report states directly.
Does AHPRA restrict what a cosmetic dentistry website can publish?
AHPRA’s advertising guidelines apply to any practitioner performing cosmetic procedures, including cosmetic dentistry, and set out what can and cannot appear on a website or in an ad. This is a rules-and-advertising question, not a conversion question, so see our full breakdown of the current dental advertising rules rather than treating this post as legal guidance.
Should a dental practice website show exact prices or price ranges?
That is a content strategy decision for the practice, not something this post can tell you is legally required. From a conversion standpoint, an enquiry form that asks a visitor to commit before they know roughly what a consultation or procedure costs adds friction at the exact point a first-time visitor is deciding whether to proceed.
Get Your Practice’s Website Benchmarked
RockingWeb builds AHPRA-compliant cosmetic dentistry and clinic websites, then measures them against benchmarks like these, not guesswork. If you want to know where your booking flow is losing visitors before you spend on a rebuild, talk to us.
Talk to us about your practice’s website
Sources and References
- Unbounce - 2024 Conversion Benchmark Report: overall methodology, sample size of 41,000+ landing pages, 464 million visitors, and 57 million conversions
- Unbounce - Healthcare & Wellness Conversion Rate benchmarks: dental, medical treatment, and wellness subcategory medians, channel-level conversion rates, mobile vs desktop performance, and reading-level statistics
Related reading:
- Cosmetic Clinic Website Booking Conversion Australia: a closer look at booking-flow friction for AHPRA-regulated clinics
- CRO Statistics Australia 2026: broader Australian conversion rate data across industries
- ADA Survey: 60% Say Social Media Drove Cosmetic Dental Choice: where cosmetic dentistry demand is forming before it reaches your website
- AHPRA Advertising Rules for Cosmetic Dentistry: the current rules governing what a dental practice can publish
Vikas Thakur
Founder of RockingWeb. 16 years building for companies like TPG, iiNet and Monadelphous, now focused on websites and marketing that comply with AHPRA's advertising guidelines and still book patients.