$36 Per $1: Australian Email Marketing Statistics 2026
Marketers report returns of $10 to $50 for every $1 they spend on email, according to Litmus's 2025 State of Email survey. Here are the real open rate, click rate, and spend numbers behind that figure, with sources for every one.
 Vikas Thakur Founder, RockingWeb 9 min read

On this page 9
- Key takeaways
- The Short Answer
- What “Return on Email” Actually Looks Like
- Open Rate and Click Rate Numbers by Industry
- How Much Australian Businesses Are Actually Spending
- The Volume Nobody Talks About
- What These Numbers Mean for Your Next Campaign
- Quick Win: Check Your Own Return Before You Change Anything
- Get Your Email Numbers Looked At
Key takeaways
- 30% of marketers report a return of $36 to $50 for every $1 they spend on email, and another 35% report $10 to $36 (Litmus, 2025 State of Email survey)
- The average email open rate across industries is 35.63%, with non-profits leading at 40.04% (Mailchimp Email Marketing Benchmarks, data as of December 2023)
- Average click-through rate sits at 2.62% across all industries and falls to 1.74% for ecommerce (Mailchimp, December 2023)
- 40% of marketers use email marketing, tying it for the second most-used channel across business sizes (HubSpot State of Marketing, 2026)
- 75% of marketers plan to hold or increase their email budget in 2026 (HubSpot State of Marketing, 2026)
- Australian businesses are forecast to spend AU$370.67 million on email advertising in 2024, rising to AU$421 million by 2029 (Statista Market Insights, cited by Red Search, 2025)
- Marketers worldwide send and receive 376 billion emails a day in 2025, on track for 408 billion by 2027 (Radicati Group, Email Statistics Report 2023 to 2027)
The Short Answer
Marketers report a return of $10 to $50 for every $1 they spend on email, per Litmus’s 2025 State of Email survey. The average open rate across industries sits at 35.63%, per Mailchimp’s 2023 data. Australian email advertising spend reached an estimated AU$370.67 million in 2024, according to Statista Market Insights.
Some marketers spend a dollar on email and get back fifty. According to Litmus’s 2025 State of Email survey of almost 500 marketing professionals across the US, UK, Canada, Australia, and Ireland, 30% report a return between $36 and $50 for every $1 they put into email marketing. Another 35% report $10 to $36 back. That is not a typo, and it is not the exception. Most paid channels would kill for numbers like that. But averages hide a wide split: plenty of businesses run email lists that barely get opened, let alone clicked. This guide pulls together the real, sourced figures, open rates, click rates, spend, and return, so you can see exactly where your own email program sits against them.
What “Return on Email” Actually Looks Like
The $36 to $50 figure gets thrown around a lot in marketing content, often with no source attached. Here is where it actually comes from.
Litmus surveyed close to 500 marketing professionals in early 2025, spanning the US, UK, Canada, Australia, and Ireland, and asked them directly what return they get from email. The answers split into clear bands, not one flat average.
| Reported return per $1 spent on email | Share of marketers reporting it |
|---|---|
| $10 to $36 | 35% |
| $36 to $50 | 30% |
| More than $50 | 5% |
That means 35% of marketers, more than one in three, report getting $36 or more back for every dollar they spend. No other channel in most marketing budgets gets close to that ratio. Paid search advertising, by comparison, typically returns about $2 for every $1 spent once campaigns are optimised, per WordStream benchmark data cited in HubSpot’s 2026 marketing statistics roundup, a fraction of what email reports. Paid social tends to trail email’s return by a similar margin, though no benchmark study breaks out a comparably specific figure for it the way WordStream does for paid search.
This is not an Australia-only number. It is a study that included Australian respondents alongside four other countries, and none of the public data breaks Australia out separately. Treat it as what marketers across similar English-speaking markets are seeing, Australia included, not as a locally isolated figure.
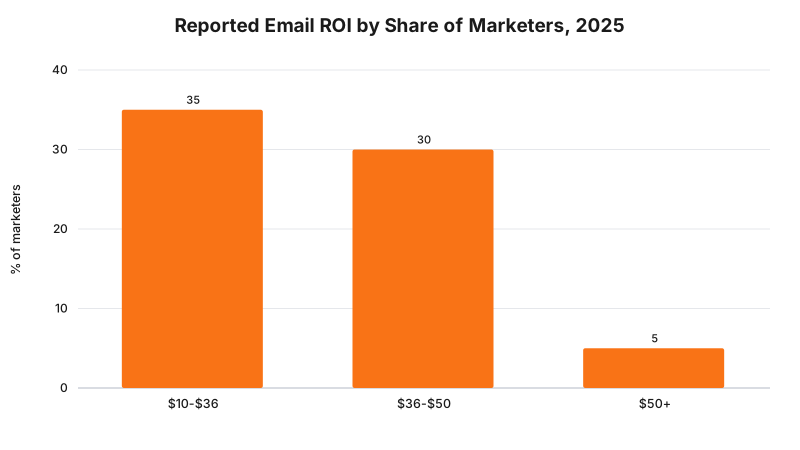
Takeaway: roughly one in three marketers get $36 or more back for every $1 they put into email, a ratio no other major paid channel matches.
Open Rate and Click Rate Numbers by Industry
Averages are useful until your industry sits well outside them. Mailchimp’s own data, drawn from its send volume and updated in December 2023, breaks open and click rates down by sector.
| Industry | Average open rate | Average click rate | Unsubscribe rate |
|---|---|---|---|
| Non-profits | 40.04% | 3.27% | 0.18% |
| Education and training | 35.64% | 3.02% | 0.18% |
| All users (overall average) | 35.63% | 2.62% | 0.22% |
| Business and finance | 31.35% | 2.78% | 0.15% |
| Ecommerce | 29.81% | 1.74% | 0.19% |
Ecommerce sits at the bottom of both open rate and click rate. That fits what most retail marketers already know: shoppers get more promotional email than anyone else, so they open less of it and click even less. A 29.81% open rate is not a failing number for a retailer. It is close to par for the sector.
HubSpot’s own 2025 data puts the average click-through rate across industries at 2.5%, close enough to Mailchimp’s 2.62% to treat both as pointing at the same real number: somewhere around one in forty recipients clicks a given email.
There is no large-scale, Australia-specific open rate study published at this level of detail. The closest regional figure comes from Campaign Monitor’s 2022 report, built on more than 100 billion sends across the Marigold platforms in 2021: the APAC region averaged a 22.4% open rate and a 3.0% click-through rate, with a 13.4% click-to-open rate. That number is older and region-wide rather than Australia-only, but it is the most direct regional comparator available.
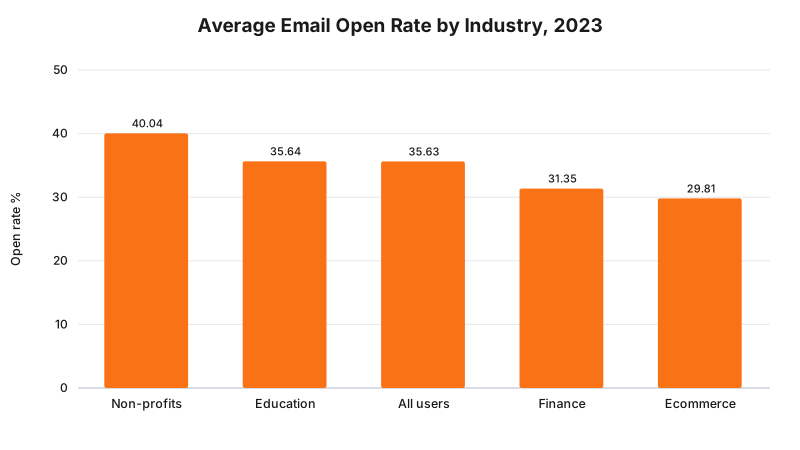
Takeaway: if your open rate sits below 30%, check your industry first. Ecommerce and finance both run well under the non-profit and education averages, and that gap is normal, not a red flag on its own.
How Much Australian Businesses Are Actually Spending
This is the one figure in this guide that is genuinely Australia-specific, not a global study with Australian participants folded in.
Statista Market Insights, cited in Red Search’s 2025-updated Australian email marketing report, forecasts Australian email advertising spend at AU$370.67 million in 2024, growing to AU$421 million by 2029. That works out to an annual growth rate of 2.58%, and roughly AU$14.17 spent per internet user in 2024.
| Metric | Figure |
|---|---|
| Australian email ad spend, 2024 | AU$370.67 million |
| Forecast Australian email ad spend, 2029 | AU$421 million |
| Annual growth rate (CAGR) | 2.58% |
| Spend per internet user, 2024 | AU$14.17 |
That growth rate is modest by digital marketing standards. Compare it to the pace of spend growth in paid social or short-form video advertising, both running well into double digits. Email is not the fast-growing channel in an Australian marketing budget. It is the steady one, and the ROI numbers above explain why businesses keep funding it even without explosive growth.
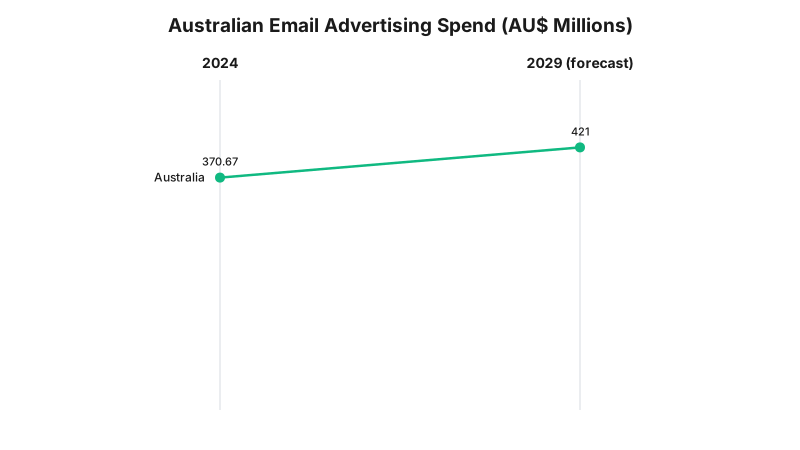
Takeaway: Australian email ad spend is forecast to grow by about AU$50 million over five years, a slow, steady climb rather than a boom, which tracks with a channel that already delivers strong returns and has less room left to improve.
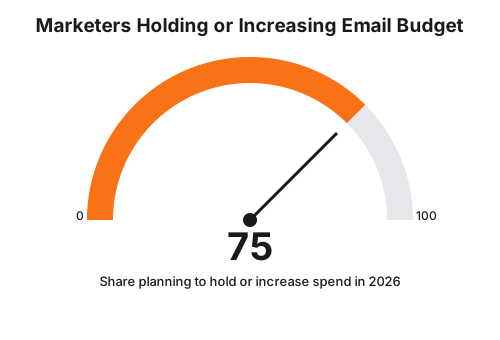
Takeaway: three in four marketers are holding or increasing email spend in 2026, which lines up with the slow but steady climb in Australian ad spend above. Nobody is walking away from a channel returning $10 to $50 per $1.
The Volume Nobody Talks About
While spend grows slowly, volume keeps climbing fast. The Radicati Group’s Email Statistics Report puts global daily email traffic, sent and received, at 376 billion in 2025, on track to hit 408 billion by 2027.
That is the backdrop every business sends into. Inboxes are not getting quieter. A subscriber who opens 35% of the emails they receive, the industry average, is still ignoring roughly two out of every three. Standing out inside that volume comes down to list quality and relevance, not send frequency.
Takeaway: global email volume keeps rising, so open rates that hold steady or improve year on year are doing real work against a genuinely noisier inbox.
What These Numbers Mean for Your Next Campaign
Put the figures together and a pattern shows up. Email is not a channel with headline growth. It is a channel with a strong, repeatable floor. A 35% open rate and a $10 to $50 return per $1 spent are numbers a well-run list can hit without a large budget, provided the basics are in place: a clean list, relevant content, and sending cadence that matches what subscribers actually signed up for.
Three things separate the businesses hitting the higher end of that ROI band from the ones stuck at the bottom:
- List hygiene. Removing subscribers who have not opened anything in six months protects your sender reputation and stops a shrinking group of engaged readers being diluted by a much larger group of disengaged ones.
- Segmentation. HubSpot’s own data shows segmented email drives 30% higher open rates and 50% more clicks than unsegmented sends. That gap alone explains a large share of the difference between a $10 return and a $36 one.
- Send frequency matched to content, not to a calendar. A weekly newsletter with nothing new to say trains subscribers to stop opening. A monthly email with something worth reading does the opposite.
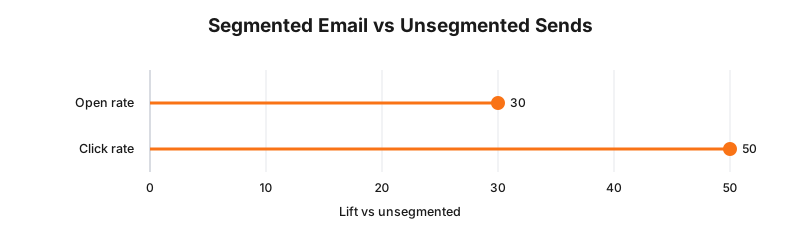
Takeaway: segmentation alone accounts for a large share of the gap between a $10 return and a $36 one, and it costs nothing to set up in most email platforms.
Quick Win: Check Your Own Return Before You Change Anything
Before touching subject lines or send times, pull three numbers from your own email platform: total email revenue for the last 90 days, total email spend for the same period, including staff time at a fair hourly rate, and your open rate against the industry figures above. That gives you your own $-per-$1 number, the same measure Litmus asked its survey respondents for. Most businesses have never actually calculated it. It takes about twenty minutes and tells you more than any single industry table can.
Get Your Email Numbers Looked At
Industry figures are a starting point, not a verdict on your own list. If you want an honest read on where your open rate, click rate, and return actually sit, and whether the platform you are on can support real segmentation and automation, our Salesforce Marketing Cloud consulting service is built for businesses ready to move past basic newsletter sends. For a smaller, less platform-specific fix, get in touch and we will tell you plainly whether your email program needs a rebuild or just a few changes.
Vikas Thakur
Founder of RockingWeb. 16 years of experience from working at TPG, iiNet and Monadelphous, now building websites, software and digital marketing for local businesses in Rockingham and Perth.