Digital Marketing Statistics Australia 2026: $18.4B Market
Australian internet advertising hit $18.4 billion in 2025, growing 11.5% year-on-year. 46 data points covering ad spend, channels, social media, email, mobile, and SMB adoption for Australian businesses in 2026.
 Vikas Thakur Founder, RockingWeb Updated Jun 17, 2026 8 min read
On this page 13
- Key Takeaways
- In Brief
- Total Australian Digital Ad Spend
- Channel Breakdown: Where Australian Budgets Go
- Programmatic Advertising in Australia
- Mobile vs Desktop Ad Spend
- Australian Social Media Statistics
- Email Marketing: Australia Outperforms Every Other Market
- Australian Business Digital Adoption
- Australian SMB Digital Marketing Budgets
- Australian Digital Ad Market Forecasts
- What These Numbers Mean for Your Business
- Ready to Turn These Statistics Into Revenue?
Key Takeaways
- $18.4 billion — Australian internet advertising spend in 2025, up 11.5% year-on-year (IAB Australia)
- 44% of all Australian digital ad spend goes to search advertising ($8.0 billion in 2025)
- 29% of total digital expenditure is now video advertising ($5.4 billion)
- 77.7% of Australians are active social media users — 21 million people
- Australia’s average email open rate is 47.69% — the highest of any country in the world
- 74% of total Australian digital advertising budgets go to mobile
- Programmatic accounts for more than 70% of all Australian digital ad spend
- Australian digital ad market forecast to reach $23 billion in 2026 (WPP Media)
In Brief
Australian internet advertising reached $18.4 billion in 2025, an 11.5% year-on-year rise, according to IAB Australia’s 2025 Internet Advertising Revenue Report.
Australia’s digital ad market has crossed $18 billion. That is not a forecast. It is the final 2025 figure from IAB Australia, published in early 2026.
For context: in 2021, the same market sat at $11 billion. In four years it grew $7 billion — an average of $1.75 billion added every year.
Behind that number sits a shift in how Australians discover, research, and buy. Search and video now command nearly three quarters of all digital spend. Social platforms have moved from “nice to have” to a primary acquisition channel for businesses of every size.
The businesses winning in this market are not the ones spending the most. They are the ones who know where every dollar goes and what it returns.
This report collects 46 statistics to give Australian business owners, marketers, and agency operators a clear picture of where the money flows, what channels perform, and what the benchmarks look like in 2026.
Total Australian Digital Ad Spend
| Year | Total Internet Ad Spend (AUD) | Year-on-Year Growth |
|---|---|---|
| 2022 | $12.9 billion | +16.4% |
| 2023 | $14.8 billion | +14.7% |
| 2024 | $16.4 billion | +11.1% |
| 2025 | $18.4 billion | +11.5% |
| 2026 (forecast) | $23.0 billion | +25.0% (projected) |
Sources: IAB Australia Internet Advertising Revenue Reports 2023–2025; WPP Media 2026 forecast.
- Australian internet advertising spend reached $18.4 billion in calendar year 2025 (IAB Australia).
- That represents 11.5% year-on-year growth — consistent with the prior year’s 11.1% lift.
- In FY2025 (July 2024 to June 2025), the figure was $17.2 billion, up 10.6% (IAB Australia FY report).
- The September 2025 quarter alone reached $4.6 billion, up 9.7% year-on-year (IAB Australia quarterly report).
- Australia’s total advertising market (all channels) is forecast to reach $30.7 billion in 2026, according to WPP Media (formerly GroupM).
- Digital channels will account for 77% of total Australian ad market spend in 2026, up from 74% in 2025.
The takeaway: digital is not a channel. It is the market. Traditional media now fills the gaps.
Channel Breakdown: Where Australian Budgets Go
| Channel | 2025 Spend (AUD) | Share of Total | YoY Growth |
|---|---|---|---|
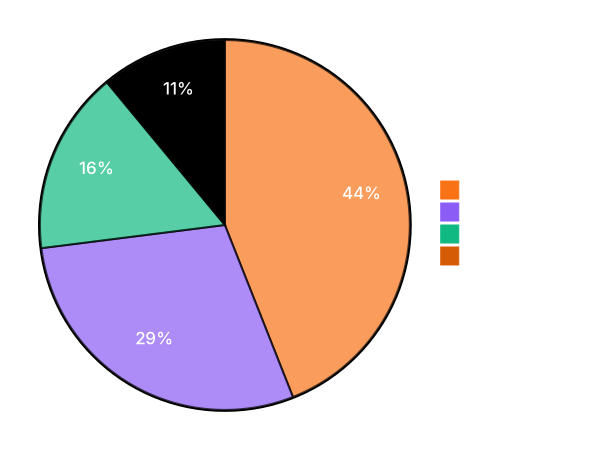
| Search & Directories | $8.0 billion | 44% | +11.5% |
| Video | $5.4 billion | 29% | +19.8% |
| Classifieds | $2.9 billion | 16% | +5.0% |
| Display (excl. video) | $2.1 billion | 11% | +1.9% |
| Digital Audio | $339 million | 2% | +8.2% |
Source: IAB Australia 2025 Internet Advertising Revenue Report.
- Search advertising reached $8.0 billion in 2025, maintaining its position as the dominant channel at 44% of all digital spend.
- Video advertising grew 19.8% — the fastest-growing format — to reach $5.4 billion, now representing 29% of total expenditure.
- Digital audio advertising hit $339 million in 2025, up 8.2% year-on-year.
- Display advertising (excluding video) grew just 1.9% to $2.1 billion, indicating advertisers have shifted budgets toward video.
- Search advertising is forecast to climb a further 3.5% to $10.8 billion in 2026 (WPP Media 2026 forecast).
- Social media advertising will grow a sharp 14.3% to $8.7 billion in 2026, fuelled by short-form video and retail media (WPP Media).
Video’s 19.8% growth rate is not an accident. Connected TV has shifted where Australians watch — and advertisers have followed.
Programmatic Advertising in Australia
- Programmatic advertising accounts for more than 70% of all Australian digital ad spend (MAGNA/IPG 2025 forecast).
- Programmatic is projected to grow at 11.1% annually through 2027 in Australia.
- Connected TV (CTV) now holds 62% of all video ad investment in Australia, ahead of both mobile (14%) and desktop (24%) within the video category (IAB Australia Q3 2025).
- In the full calendar year 2025, CTV captured 57% of all video inventory investment, with mobile at 30% and desktop at 13%.
Mobile vs Desktop Ad Spend
- Mobile accounts for 74% of total Australian digital advertising budgets across all formats.
- Within the video category specifically, mobile holds a 30% share and desktop just 13%, with CTV taking the remainder.
- Desktop’s share of video investment fell to 13% in 2025 — its lowest level on record (IAB Australia).
- 53% of mobile visitors will leave a page if it takes longer than 3 seconds to load (Google).
The money is on mobile. The experience, for many Australian businesses, has not caught up.
Australian Social Media Statistics
| Platform | Australian Users | Population Penetration |
|---|---|---|
| 17.7 million | 65% | |
| 12.9 million (est.) | ~70% of adults | |
| TikTok | 10.9 million (18+) | 40%+ |
| 18 million members | ~85% of adults | |
| YouTube | Majority of population | 50%+ |
Sources: We Are Social / Meltwater Digital 2026 Australia; DataReportal Digital 2025 Australia.
- 21 million Australians are active social media users — 77.7% of the total population (We Are Social / Meltwater Digital 2026).
- Among Australian adults aged 18 and over, 87% are on at least one social platform.
- Facebook reaches 78% of Australian internet users, with 17.7 million users visible on Meta’s ad tools.
- LinkedIn has 18 million members in Australia — approximately 85% of the adult population — as of late 2025.
- TikTok reached 10.9 million Australians aged 18+ in 2025, up 13.9% year-on-year (DataReportal).
- TikTok users in Australia average 1 hour and 14 minutes per day on the platform (We Are Social Digital 2026).
- 6 in 10 Australians use social media to research brands each month — a rate nearly matching search engine usage (We Are Social 2026).
- Social media advertising in Australia grew 12% year-on-year to US$4.26 billion, representing 29% of total digital ad spend (We Are Social 2026).
Australia passed a social media ban for users under 16 in December 2025. The long-term impact on platform demographics is still playing out, but it has not affected total usage numbers among the adult market.
Email Marketing: Australia Outperforms Every Other Market
| Metric | Australia | Global Average |
|---|---|---|
| Average open rate | 47.69% | ~38% |
| Average click rate | 2.82% | ~2.1% |
| Click-to-open rate | 8.3% | ~7.2% |
Sources: Brevo Email Marketing Benchmarks 2026; Vision6 Australian Email Benchmarks.
- Australian email campaigns achieve an average open rate of 47.69% — the highest of any country globally (Brevo 2026 Benchmarks).
- The average email click rate in Australia is 2.82%, also the highest global figure.
- Australia’s click-to-open rate is 8.3%, indicating that Australians who open emails are also highly likely to click.
- Email marketing delivers an average return of $42 for every $1 spent across developed markets — one of the highest ROI figures in any digital channel (DMA / Shopify Australia data).
- Email from traffic source converts at 2–5% on Australian websites, outperforming social and direct traffic benchmarks.
These numbers change how you think about your email list. A 47% open rate is not a passive channel — it is your most responsive audience.
Australian Business Digital Adoption
- There were 2,729,648 actively trading businesses in Australia as of 30 June 2025 (ABS Counts of Australian Businesses).
- Australian consumers spent AU$82.6 billion online in 2025, representing 13.9% year-on-year growth.
- The ABS recorded AU$4.7 billion in online retail sales in June 2025 alone — 13% annual growth.
- Nearly 9.8 million Australian households made an online purchase during 2025.
- Online marketplaces became Australia’s largest e-commerce category in 2025, generating AU$18.9 billion in online spending.
- Fashion and apparel generated AU$11.6 billion in Australian online sales during 2025.
- Google commands 94% of Australia’s search market share and 96% of search advertising revenue (ACCC data).
Australian SMB Digital Marketing Budgets
| Business Type | Recommended Digital Budget (% of Revenue) |
|---|---|
| Micro / sole trader | 5–7% |
| Small to medium business | 7–10% |
| Growth-focused brands | 10–14% |
| B2B companies | 2–5% |
| B2C companies | 5–10% |
Sources: Australian Marketing Institute; ACT Marketing Group; Conquerr Digital 2026 Budget Benchmarks.
- Australian SMBs are advised to allocate 7–10% of annual revenue to digital marketing — the widely accepted starting point for growth-stage businesses.
- The Australian Marketing Institute suggests 10–12% of yearly revenue as the appropriate total marketing budget.
- 65% of Australian SMBs now run paid advertising, but most waste 61% of their budget on wrong keyword targeting.
- Average monthly Google Ads spend for Australian SMBs ranges AUD $5,000–$20,000.
- The average Google Ads cost-per-click in Australia is $2–$4 AUD, rising to $50+ AUD in competitive industries like legal and insurance.
Australian Digital Ad Market Forecasts
- Australia’s digital advertising market is forecast to grow at a CAGR of 14.6% from 2026 to 2029 (ResearchAndMarkets Australia Digital Ad Spend Databook Q1 2026).
- The Australian digital marketing market reached USD $13.93 billion in 2025 and is projected to reach USD $27.15 billion by 2035 at a CAGR of 6.9% (Expert Market Research).
- Retail media is the fastest-growing digital channel in Australia, with spend forecast to rise 28.1% in 2025 and 24.4% in 2026 (WPP Media).
- Retail media is on track to surpass total TV ad revenue in Australia for the first time in 2027 (WPP Media).
- Influencer advertising in Australia reached $590 million USD in spend, growing 13.5% year-on-year (We Are Social Digital 2026).
What These Numbers Mean for Your Business
The data tells a consistent story.
Search and video command the budget. Mobile receives three quarters of all digital investment. Social media is not optional — it is where your customers spend an average of 1 hour and 14 minutes per day. And email, which many businesses have deprioritised in favour of social, is delivering the highest open rates in the world.
Australian businesses that are winning in 2026 are not doing all of this at once. They are picking two or three channels, measuring the return, and reinvesting based on what the numbers show.
The ones losing money are the ones who run campaigns without knowing their cost-per-acquisition — and never find out.
Ready to Turn These Statistics Into Revenue?
We work with Australian businesses in Perth and across the country to build digital marketing systems that can be measured. Not vanity metrics. Revenue.
If you want to know where your budget should go based on your industry, margin, and growth targets, talk to us at rockingweb.com.au/services/.
Vikas Thakur
Founder of RockingWeb. 16 years building for companies like TPG, iiNet and Monadelphous, now focused on websites and marketing that comply with AHPRA's advertising guidelines and still book patients.