$82.6 Billion: Australian E-commerce Statistics 2026
Australians spent $82.6 billion online in 2025, up 14% year-on-year, according to Australia Post's 2026 eCommerce Report. Here are the category breakdowns, growth trends, and checkout figures behind that number.
 Vikas Thakur Founder, RockingWeb 7 min read
Key takeaways
- $82.6 billion: total Australian online spend in 2025, up 14% year-on-year (Australia Post eCommerce Report 2026)
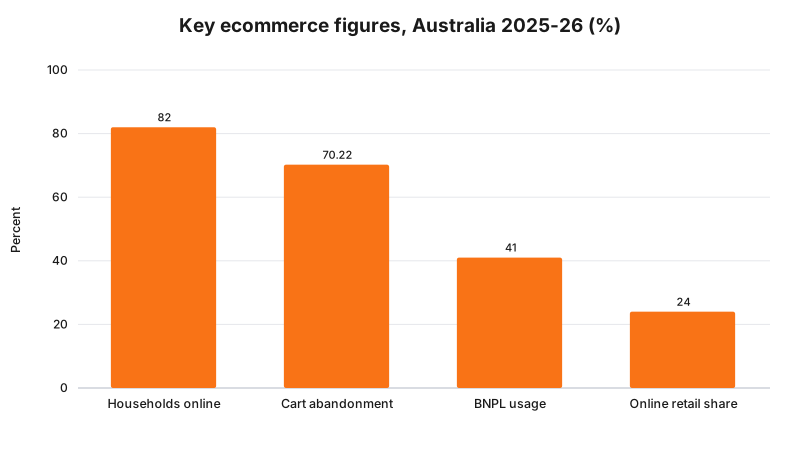
- 24%: online retail’s share of total Australian retail spend in 2025 (Australia Post eCommerce Report 2026)
- 9.8 million: Australian households, 82% of all households, that bought something online in 2025 (Australia Post eCommerce Report 2026)
- $96: average online transaction value, roughly $10 lower than in 2020 (Australia Post eCommerce Report 2026)
- $18.9 billion: spend through online marketplaces, 23% of total online spend (Australia Post eCommerce Report 2026)
- $66.23 billion: online retail spend in the 12 months to September 2025, up 12.5% year-on-year (NAB Online Retail Sales Index, September 2025)
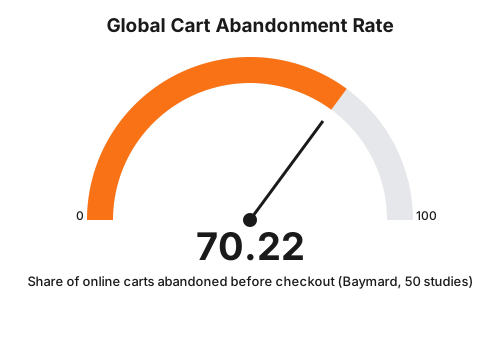
- 70.22%: the global average cart abandonment rate across 50 studies, not an Australia-specific figure (Baymard Institute, September 2025)
- 41%: Australians who used a buy now, pay later service in the past six months (Finder Australia, March 2026)
Australians spent $82.6 billion online in 2025, up 14% year-on-year, according to Australia Post’s 2026 eCommerce Report. Online retail now makes up 24% of total Australian retail spend, spread across 9.8 million households.
That $82.6 billion figure is not a projection. It is what Australians actually spent online across 2025, a 14% jump on 2024, according to Australia Post’s 2026 eCommerce Report.
9.8 million households, more than four in five in the country, bought something online last year. The average transaction still fell to just $96, roughly $10 lower than in 2020, as shoppers spread their spending across more retailers and more occasions.
Marketplaces, fashion, and home goods each pulled in over $11 billion, while cart abandonment and payment habits quietly decided who kept that money and who lost it at checkout. If you sell online, or you are deciding whether to, these figures set the standard for what real growth, real friction, and real payment habits look like right now.
Below: the market size, the category split, the growth trend through 2025, and the checkout data worth planning your 2026 year around.
Australia’s Online Retail Market in 2025
Two independent sources point at the same story: Australian online retail is growing three to four times faster than retail as a whole.
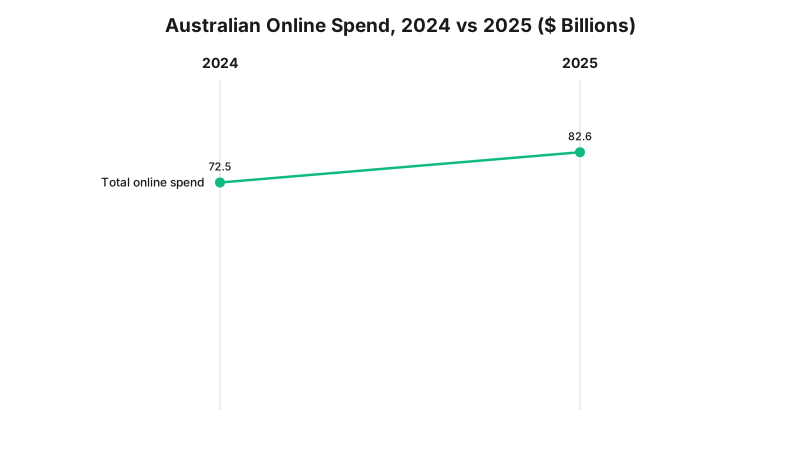
Australia Post tracks the broadest view, using parcel and delivery data across the whole market. It puts 2025 online spend at $82.6 billion, up from $72.5 billion in 2024, a 14% year-on-year increase. That growth pushed online retail’s share of total Australian retail spend to 24%.
NAB runs a separate index, built from card transaction data across a narrower set of merchants. It puts online retail spend at $66.23 billion in the 12 months to September 2025, up 12.5% year-on-year, and equal to about 14.9% of the ABS’s total retail trade estimate. The two indexes measure different slices of the market, which is why the dollar figures differ, but they agree on the direction: double-digit annual growth, well ahead of total retail.
For comparison, the ABS Monthly Household Spending Indicator showed total retail growth of just 3.7% year-on-year in August 2025. Online retail is not just growing. It is taking share.
| Measure | 2025 figure | Growth | Source |
|---|---|---|---|
| Total online spend | $82.6 billion | +14% YoY | Australia Post eCommerce Report 2026 |
| Online share of retail | 24% | up from prior year | Australia Post eCommerce Report 2026 |
| NAB online spend (12mo to Sep 2025) | $66.23 billion | +12.5% YoY | NAB Online Retail Sales Index |
| Total retail growth | n/a | +3.7% YoY | ABS Monthly Household Spending Indicator |
One line worth remembering: online retail grew at roughly four times the rate of total retail in 2025, and it is not slowing down enough to change that pattern in 2026.
Where Australians Spend Online
Online marketplaces took the largest single share of 2025 spend: $18.9 billion, or 23% of the total, spread across platforms like Amazon and Temu. Fashion and apparel came next at $11.6 billion, followed closely by home and garden at $11.4 billion.
Everything else, electronics, groceries, health, hobbies, and hundreds of smaller categories, made up the remaining $40.7 billion.
| Category | 2025 spend (AUD) | Share of total online spend |
|---|---|---|
| Online marketplaces | $18.9 billion | 23% |
| Fashion and apparel | $11.6 billion | 14% |
| Home and garden | $11.4 billion | 14% |
| All other categories | $40.7 billion | 49% |
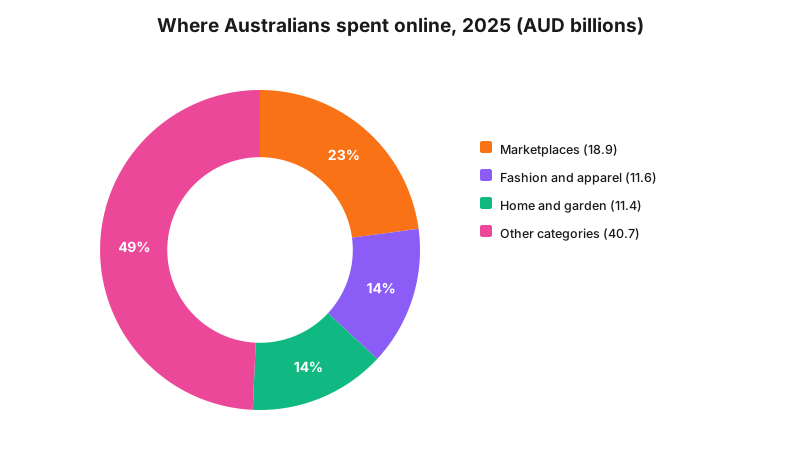
Marketplaces are the single biggest category by a wide margin, but they are still less than a quarter of the total. Most online spend still happens on independent retailer websites, not on Amazon or Temu.
The Growth Trend Through 2025
Growth was not flat across the year. NAB’s monthly index shows online retail spend accelerating through the first half of 2025 before easing slightly into spring.
| Month (2025) | 12-month growth (year-on-year) |
|---|---|
| January | 10.2% |
| February | 10.8% |
| May | 13.2% |
| July | 13.9% |
| August | 14.4% |
| September | 12.5% |
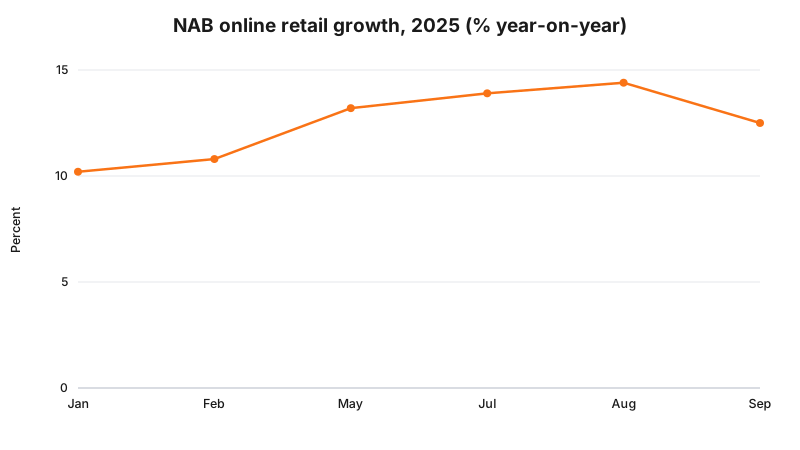
August 2025 was the peak of the year at 14.4% growth. September’s dip to 12.5% still left the market firmly in double digits, well above the pace of total retail trade across the same period.
Checkout Behaviour: What Slows Shoppers Down and What Speeds Them Up
Two figures matter more than any other for a business running its own checkout: cart abandonment and payment method.
The Baymard Institute’s aggregate of 50 cart abandonment studies puts the global average at 70.22%, last updated September 2025. This is a global figure, not an Australia-specific one, and no verified Australia-only cart abandonment study exists to cite in its place. Treat it as a rough international standard rather than a precise local number. The leading cause, cited across multiple Baymard studies, is unexpected extra costs at checkout, mostly shipping and taxes that only appear at the final step.
On the payment side, buy now, pay later has settled into a genuine mainstream habit. 41% of Australians used a BNPL service in the past six months, according to Finder Australia’s March 2026 survey, a figure that has held above 40% for roughly five years. Usage skews younger: 59% of Gen Y and 57% of Gen Z respondents had used BNPL, against 30% of Gen X and 15% of Baby Boomers. From 10 June 2025, BNPL providers became regulated as “low cost credit contracts” under the National Consumer Credit Protection Act, meaning they now need an Australian credit licence and must meet a modified set of responsible lending obligations tailored to BNPL products (ASIC Regulatory Guide 281).
If your checkout does not show shipping costs before the final page, you are handing customers a reason to leave right when they are closest to buying.
What This Means If You Sell Online
None of these figures are abstract. They translate directly into decisions.
An average transaction value of $96 means most Australian shoppers are making small, frequent purchases rather than large, occasional ones. If your average order value sits well above that, work out why, and whether a lower-friction, lower-price entry product would capture more of the market that is currently going elsewhere.
Marketplaces taking 23% of online spend does not mean every product needs to be on Amazon. It means shoppers now expect the marketplace experience, clear pricing, fast delivery estimates, and visible reviews, on your own site too. Retailers that copy those expectations onto their own checkout tend to close more of the sales they were losing to cart abandonment.
BNPL sitting at 41% usage is no longer a nice-to-have integration. For any store selling items over roughly $50, not offering a BNPL option at checkout is opting out of a payment method more than a third of your potential customers actively look for.
None of this fixes itself. A checkout that leaks 70% of carts, a site that hides shipping costs until the last step, or a store with no BNPL option is losing sales this quarter, not eventually.
If you want a second set of eyes on where your store is losing ground against these figures, talk to our team about a website review. We work with Australian businesses to find the specific friction points costing them sales, not generic advice.
Sources and References
- Australia Post. (2026). “eCommerce Report 2026.” auspost.com.au/business/ecommerce/ecommerce-report
- NAB. (2025). “NAB Online Retail Sales Index, September 2025.” business.nab.com.au
- Australian Bureau of Statistics. (2025). “Monthly Household Spending Indicator, August 2025.” abs.gov.au
- Baymard Institute. (2025). “50 Cart Abandonment Rate Statistics.” baymard.com/lists/cart-abandonment-rate
- Finder Australia. (2026). “Buy Now Pay Later Statistics.” finder.com.au/buy-now-pay-later/buy-now-pay-later-statistics
- Australian Securities and Investments Commission. (2025). “Regulatory Guide 281: Low Cost Credit Contracts.” asic.gov.au/regulatory-resources/find-a-document/regulatory-guides/rg-281-low-cost-credit-contracts
Note: dollar figures from Australia Post and NAB measure different slices of the online retail market and are not directly interchangeable. Cart abandonment data is a global figure, not Australia-specific. All statistics were verified against primary or first-tier sources in August 2026.
Vikas Thakur
Founder of RockingWeb. 16 years of experience from working at TPG, iiNet and Monadelphous, now building websites, software and digital marketing for local businesses in Rockingham and Perth.