27% Margin: Dental Practice Profit in Australia 2026
Established Australian dental practices keep an average 27% margin once every cost is paid, according to the ATO's 2023-24 small business benchmarks. Smaller practices average 39%, and margin narrows as revenue grows.
 Vikas Thakur Founder, RockingWeb 8 min read

Key takeaways
- Dental practices earning more than $815,000 a year keep an average 27% margin, per the ATO’s 2023-24 small business benchmarks
- Smaller practices, turning over $50,000 to $435,000, average a 39% margin, the highest of the three ATO turnover brackets
- Total expenses eat 61% to 73% of turnover on average, and the share rises as practices grow
- Labour costs alone run 23% to 41% of turnover depending on practice size, the single biggest line item in every bracket
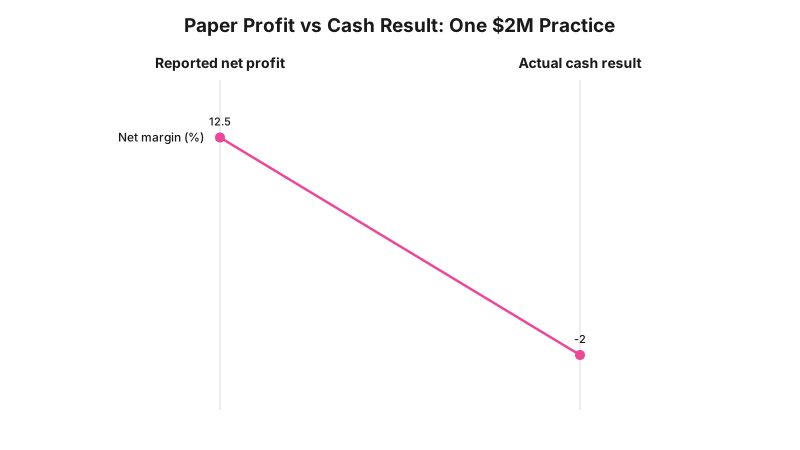
- One $2 million revenue practice reported a 12.5% net profit margin on its accounts, then an actual $40,000 cash loss once tax, loan repayments and staff entitlements were paid, per Insight Dental Consulting’s analysis
- Registered dentist numbers grew 28% in a decade, from about 15,800 in 2014 to 20,300 in 2023, per AIHW workforce data
- Australia’s dental services industry is valued at $14.5 billion in 2025 across roughly 20,347 businesses, per IBISWorld
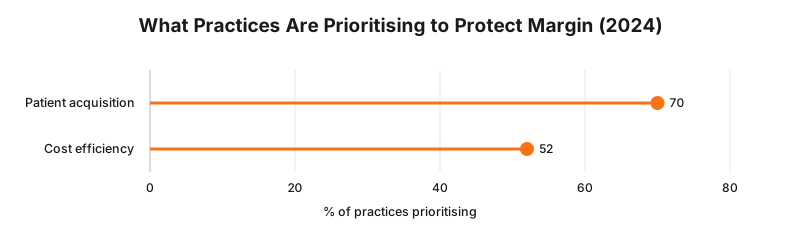
- 52% of dental practices are prioritising cost-efficiency initiatives to protect margin, per CommBank’s 2024 Dental Insights Report (n=414)
An established Australian dental practice keeps an average 27% margin once every cost is paid, according to the Australian Taxation Office’s 2023-24 small business benchmarks. That figure covers practices turning over more than $815,000 a year. Smaller practices do better on the ATO’s numbers, averaging 39%. But a margin percentage on a tax return is not the same thing as cash sitting in a bank account, and one real Australian case study shows exactly how far the two can diverge. This post breaks down where dental practice revenue actually goes, using the ATO’s own benchmark data, a real practice case study, and workforce and industry figures that explain why margin keeps getting harder to hold onto.
What the ATO’s Benchmarks Actually Measure
The ATO publishes small business benchmarks for dental surgeons every year, built from information reported on tax returns. The most recent set covers the 2023-24 financial year and splits general dental practices into three turnover bands. Each band reports total expenses as a share of turnover, which is the clearest public window into dental practice cost structure that exists in Australia.
| Annual turnover | Total expenses to turnover (average) | Implied profit margin |
|---|---|---|
| $50,000 to $435,000 | 61% | 39% |
| $435,001 to $815,000 | 69% | 31% |
| More than $815,000 | 73% | 27% |
The pattern runs the opposite way to what most owners expect. Margin does not improve as a practice scales past the entry-level bracket. It narrows. A solo practitioner working from a single surgery keeps proportionally more of every dollar than a multi-chair clinic with a full support team, because the second practice carries staff, premises and equipment costs the first one doesn’t.
One caveat matters here: the ATO’s “total expenses” figure doesn’t include a wage the owner pays themselves, since a sole trader’s own drawings aren’t a deductible business expense. The implied margin above is closer to what becomes the owner’s taxable income than a clean net profit figure after paying every working owner a market wage.
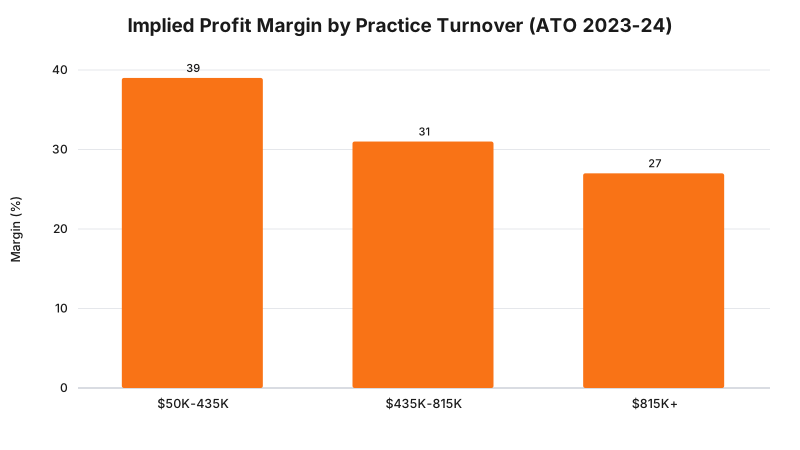
Takeaway: the ATO’s own benchmark data shows margin shrinking, not growing, as a dental practice scales past $435,000 in turnover.
Where the Money Actually Goes
The ATO benchmarks also break out labour, rent and motor vehicle costs as a share of turnover for each bracket. Applying the midpoint of each range to the $815,000-plus bracket shows where the 73 cents in every revenue dollar actually goes.
| Cost category | ATO range ($815K+ bracket) | Midpoint used below |
|---|---|---|
| Labour | 23% to 37% | 30% |
| Rent | 4% to 7% | 5.5% |
| Motor vehicle | 0% to 1% | 0.5% |
| Other operating costs (materials, lab fees, admin, marketing) | Balance to reach 73% total | 37% |
The “other operating costs” row is not an ATO line item. It’s what’s left once labour, rent and motor vehicle are subtracted from the 73% total expenses average, and it covers everything from dental materials and lab fees to software, insurance and marketing spend.
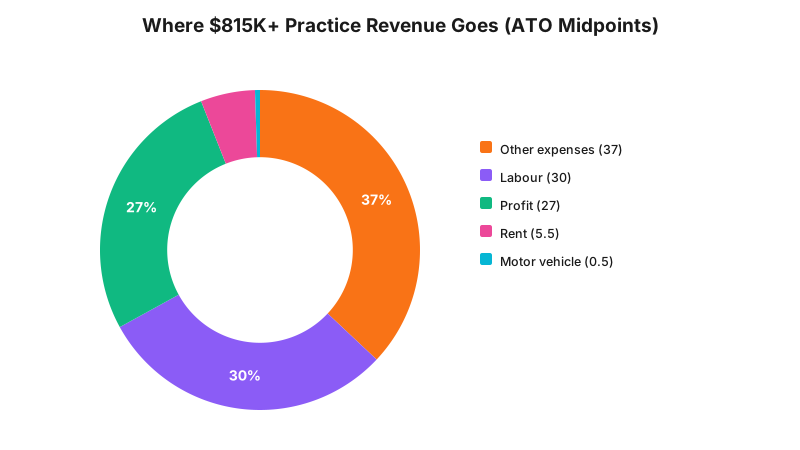
Labour is the single biggest controllable line item, running close to a third of turnover for a larger practice. Every dollar spent on marketing that doesn’t produce a booking competes directly against that same 27% margin.
Takeaway: labour and undifferentiated operating costs, not rent or vehicles, are what actually determine whether a practice lands nearer 27% or nearer 39%.
Paper Profit vs Cash Reality
A benchmark percentage describes an average practice, not a specific one, and the gap between an accounting margin and an actual cash result can be large. Insight Dental Consulting’s analysis of a $2 million revenue Australian practice found a 12.5% net profit margin on the accounts, worth $250,000. Once corporate tax, staff entitlement provisions, loan principal repayments, a small bad debt allowance and the capital savings required to replace depreciating assets were paid out of that figure, the practice’s actual cash position for the year was a $40,000 loss.
| Line item | Amount |
|---|---|
| Reported net profit (accounts) | $250,000 |
| Corporate tax (30%) | -$75,000 |
| Staff entitlements (25% of wages) | -$60,000 |
| Loan principal repayments | -$80,000 |
| Bad debts | -$5,000 |
| Capital savings required (equal to depreciation) | -$70,000 |
| Actual cash result | -$40,000 |
That gap exists because “net profit” on a set of accounts is a tax and reporting figure, not a cash flow statement. Loan principal repayments in particular never appear as an expense on a profit and loss report, since only the interest portion does, but the principal still has to be paid out of the bank account every month. Depreciation works in the opposite direction: it reduces reported net profit as a non-cash expense, but the practice still has to set aside real cash to eventually replace the equipment it represents, which is what the capital savings line captures.
A practice running that tight can’t absorb wasted marketing spend or a compliance breach that triggers legal costs or a forced site rebuild. RockingWeb checks a site and ad accounts against current advertising rules before a problem turns into an unbudgeted cost.
Takeaway: a healthy margin on paper can still be a cash loss once tax, entitlements and debt repayments come out, so cash flow deserves as much attention as the margin percentage itself.
Growing Competition, Same Advertising Rules
Registered dentist numbers in Australia grew from about 15,800 in 2014 to around 20,300 in 2023, a 28% increase in under a decade, according to AIHW workforce data. IBISWorld puts the industry at roughly 20,347 businesses and $14.5 billion in revenue for 2025. More practitioners chasing a market growing more slowly than the workforce means competition for each new patient keeps rising, and every dollar spent winning that patient comes straight off the margin figures above.
CommBank’s 2024 Dental Insights Report, based on a survey of 414 dental decision-makers across Australia, found 70% of practices prioritising at least one patient acquisition initiative and 52% prioritising cost-efficiency measures such as reducing or restructuring operational spend.
Dental advertising sits under the same AHPRA rules as cosmetic clinic advertising: no patient testimonials, strict limits on before-and-after imagery, and a duty of care that has to outweigh any commercial pressure to drive demand. Rather than re-deriving those rules from scratch, see RockingWeb’s dental advertising rules guide for the full current requirements as they apply to dental marketing specifically.
Takeaway: a growing, more competitive dentist workforce means acquisition spend has to work harder without breaching the same advertising rules cosmetic clinics operate under.
Where Website Spend Actually Moves Margin
Given labour and undifferentiated operating costs already absorb most of practice turnover, the lever most practices actually control is the cost of winning each new patient. A slow, poorly structured booking site pushes that cost up regardless of how much is spent on ads, because visitors who can’t find pricing or book quickly simply leave. A fast, treatment-specific site built to convert search intent into a booked consultation lowers acquisition cost without touching the compliance risk covered above.
RockingWeb builds cosmetic clinic websites around that brief for dental and cosmetic clinics alike: pages built for the treatments that actually drive bookings, compliant with current AHPRA and dental board advertising rules, and structured so a visitor can book rather than hunt for a phone number.
Takeaway: the fastest way to protect a 27% margin isn’t cutting clinical costs, it’s lowering what it costs to win the next booking.
Get Your Practice’s Numbers Reviewed
A margin in the high 20s doesn’t leave much room for wasted marketing spend or an avoidable compliance problem. RockingWeb reviews dental and cosmetic clinic websites against current advertising rules and rebuilds them to convert more of the traffic already arriving.
Talk to RockingWeb about your practice’s website and patient acquisition
Sources and References
- Australian Taxation Office - Small business benchmarks, dental surgeons (general), 2023-24 financial year: total expenses, labour, rent and motor vehicle expenses as a percentage of turnover.
- Insight Dental Consulting - Analysis of a $2 million revenue Australian dental practice comparing reported net profit against actual cash position after tax, entitlements and loan repayments.
- Australian Institute of Health and Welfare - Dental workforce data, registered dentist numbers 2014 to 2023.
- Commonwealth Bank - 2024 Dental Insights Report, survey of 414 dental practice decision-makers across Australia, October to November 2023.
- Dental Industry Australia: Market Statistics: RockingWeb’s related research on dental industry revenue, business counts and workforce figures, sourced to IBISWorld and AIHW.
Related reading:
- AHPRA Advertising Rules for Cosmetic Dentistry: current dental board advertising rules covering testimonials and before-and-after imagery.
- Cosmetic Clinic Websites: AHPRA-compliant website builds for dental and cosmetic clinics, built to convert bookings.
Data current as of the ATO’s 2023-24 small business benchmarks, the most recently published set at time of writing.
Vikas Thakur
Founder of RockingWeb. 16 years of experience from working at TPG, iiNet and Monadelphous, now building websites, software and digital marketing for local businesses in Rockingham and Perth.