53% of Visitors Abandon Slow Sites: Page Speed Stats 2026
53% of mobile visitors abandon a page that takes longer than three seconds to load, according to Google's mobile speed research. Here is the current data on page speed and conversion rate, from Core Web Vitals pass rates to what a one-second delay costs an e-commerce checkout.
 Vikas Thakur Founder, RockingWeb 9 min read
Key takeaways
- 53% of mobile visitors abandon a page that takes longer than three seconds to load (Google, “The Need for Mobile Speed,” 2016)
- E-commerce conversion rate falls from 3.05% at a one-second load to 1.12% at three seconds, a drop of almost two-thirds (Portent, 100+ million page views)
- Only 48% of mobile websites pass all three Core Web Vitals thresholds, against 56% on desktop (HTTP Archive, 2025 Web Almanac, July 2025 CrUX data)
- Largest Contentful Paint is the weakest Core Web Vital on mobile, passing on just 62% of sites (HTTP Archive, 2025)
- A 0.1-second speed improvement lifted retail conversions by 8.4% and travel bookings by 10% (Google and Deloitte Digital, “Milliseconds Make Millions,” 2020)
- A one-second B2B site converts 3x higher than a five-second site, and 5x higher than a ten-second site (Portent)
- Median mobile internet speed in Australia reached 122.2 Mbps in 2025, so a slow site is rarely a network problem (DataReportal, Digital 2026 Australia)
53% of mobile visitors abandon a page that takes over three seconds to load, according to Google’s mobile speed research. E-commerce conversion rate drops from 3.05% at a one-second load to 1.12% at three seconds (Portent, global data). Median Australian mobile speed hit 122.2 Mbps in 2025 (DataReportal), so a slow site is rarely a network problem.
53% of mobile visitors leave a page that takes longer than three seconds to load. Google found that number back in 2016, and every fresh round of Core Web Vitals data since says it still holds. Right now, only 48% of mobile websites pass Google’s own Core Web Vitals thresholds, and the biggest culprit is Largest Contentful Paint, the metric for how long the main content takes to appear. That gap is not cosmetic. Portent tracked 100 million page views across 20 e-commerce and lead-generation sites and found conversion rate falls from 3.05% at a one-second load to 1.12% at three seconds. Deloitte’s work with Google found the same pattern in reverse: shave 0.1 seconds off load time and retail conversions climb 8.4%. This report rounds up the current data on page speed and conversion rate, benchmarked against 2025 Core Web Vitals figures and Australia’s own network speeds. You will see exactly how much a slow site costs, and where the fix actually needs to happen.
The Three-Second Abandonment Threshold
Google’s “The Need for Mobile Speed” research, run through DoubleClick by Google in 2016, is still the most-cited number in page speed writing for a reason: it is blunt, and nothing since has overturned it. Mobile visitors give a page about three seconds before they leave. Miss that window and 53% of them are gone before your content even finishes rendering.
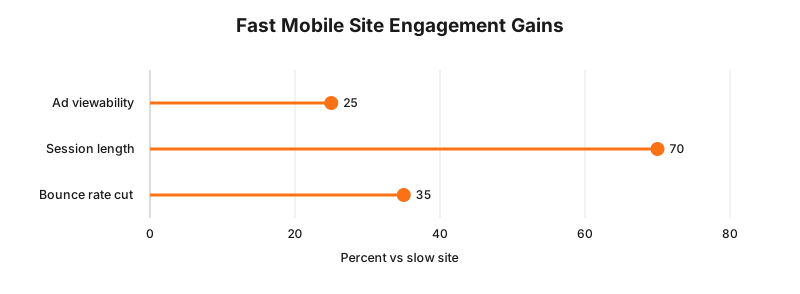
The same research found that mobile sites loading within five seconds saw 25% higher ad viewability, 70% longer average sessions, and a 35% lower bounce rate than sites that took closer to 19 seconds on a typical connection at the time. That connection gap has narrowed since 2016, but the behaviour has not changed. A slow first impression still reads as a broken one.
| Metric | Value | Source |
|---|---|---|
| Mobile visitors who abandon a page loading in 3+ seconds | 53% | Google, “The Need for Mobile Speed,” 2016 |
| E-commerce conversion rate at a 1-second load | 3.05% | Portent, 2022 data |
| E-commerce conversion rate at a 3-second load | 1.12% | Portent, 2022 data |
| Median mobile internet speed, Australia | 122.2 Mbps | DataReportal, Digital 2026 Australia |
Takeaway: three seconds is not a suggestion. It is the point where more than half your mobile traffic decides you are not worth waiting for.
How Load Time Shapes Conversion Rate, Second by Second
Abandonment is the blunt version of the story. Portent’s ongoing site speed research puts a finer point on it by tracking what actually converts, not just what leaves.
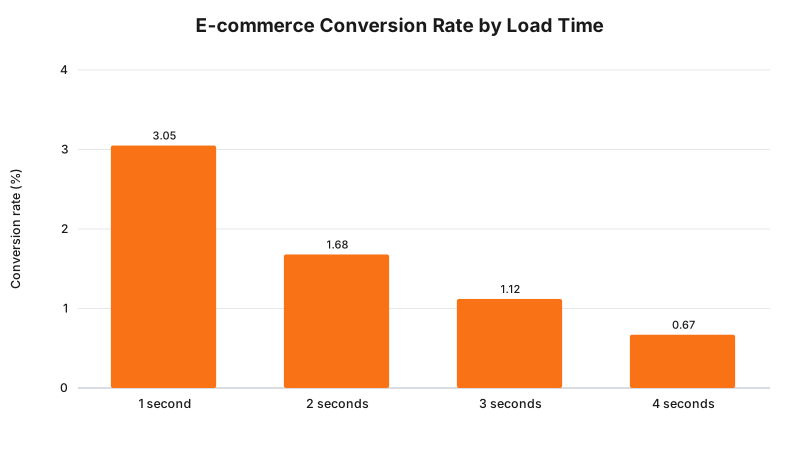
The study pulled a 30-day snapshot across 20 websites, six B2C e-commerce sites and 14 B2B lead-generation sites, covering more than 100 million page views, 5.6 million sessions and over 27,000 landing pages. For e-commerce, conversion rate does not decline in a straight line as load time rises. It falls fast in the first few seconds, then keeps sliding.
| Load Time | E-commerce Conversion Rate |
|---|---|
| 1 second | 3.05% |
| 2 seconds | 1.68% |
| 3 seconds | 1.12% |
| 4 seconds | 0.67% |
Source: Portent, Site Speed and Conversion Rate Research.
B2B lead-generation sites showed the same shape, just at higher absolute rates. A site that loads in one second converts 3x higher than a five-second site, and 5x higher than a ten-second site. Portent also found 86% of the e-commerce pages it measured loaded in five seconds or less, up from 81% when the study first ran in 2019, so the industry is getting faster overall even as the gap between fast and slow sites keeps deciding who wins the sale.
Takeaway: the drop from one second to three seconds costs an e-commerce site almost two-thirds of its conversion rate, before anyone even reaches your checkout.
The 0.1-Second Payoff
If losing speed costs conversions, gaining it should pay them back. Google commissioned Deloitte Digital to test exactly that in the “Milliseconds Make Millions” study, published in 2020 after analysing mobile site data from 37 European and American brands across more than 30 million user sessions, spanning retail, travel, luxury and lead-generation.
The finding: a 0.1-second improvement in mobile load time was enough to move conversion behaviour across the whole funnel, not just at the point of purchase.
| Industry | Primary Lift | Secondary Lift |
|---|---|---|
| Retail | 8.4% more conversions | 9.2% higher average order value |
| Travel | 10% more bookings | 2.2% more checkout completions |
Source: Google and Deloitte Digital, “Milliseconds Make Millions,” 2020.
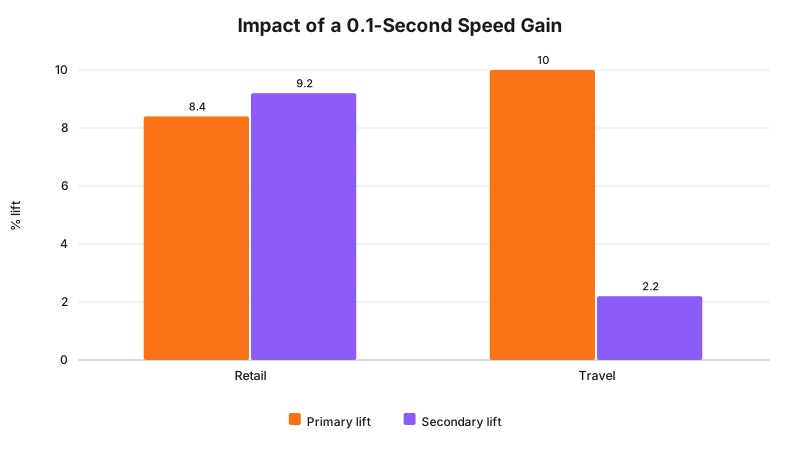
Luxury retail saw a 40.1% lift in product-to-basket progression from the same 0.1-second gain, and lead-generation sites saw a 21.6% lift in form submission progression, both reported in the same Google and Deloitte Digital study cited above. None of these brands rebuilt their site from scratch. A tenth of a second is often the difference between an unoptimised hero image and a compressed one, or a render-blocking script and a deferred one.
Takeaway: you do not need a full rebuild to move conversion rate. A tenth of a second, found in the right place, is worth more than most redesigns.
Core Web Vitals: Most Sites Still Fail the Speed Test
Page speed used to be a vague idea. Google’s Core Web Vitals turned it into three measurable thresholds: Largest Contentful Paint (how fast the main content appears), Interaction to Next Paint (how fast the page responds to a click or tap) and Cumulative Layout Shift (how much the page jumps around while loading).
The HTTP Archive’s 2025 Web Almanac, built on July 2025 CrUX data covering millions of real Chrome sessions, found that most mobile sites still fail the combined test. Only 48% of mobile websites pass all three thresholds, against 56% on desktop. Mobile has improved steadily, up from 36% in 2023 and 44% in 2024, but it is still under half.
| Core Web Vital | Mobile Pass Rate | Desktop Pass Rate |
|---|---|---|
| Largest Contentful Paint (LCP) | 62% | 74% |
| Interaction to Next Paint (INP) | 77% | 97% |
| Cumulative Layout Shift (CLS) | 81% | 72% |
| All three combined | 48% | 56% |
Source: HTTP Archive, 2025 Web Almanac, Performance chapter, July 2025 CrUX dataset.
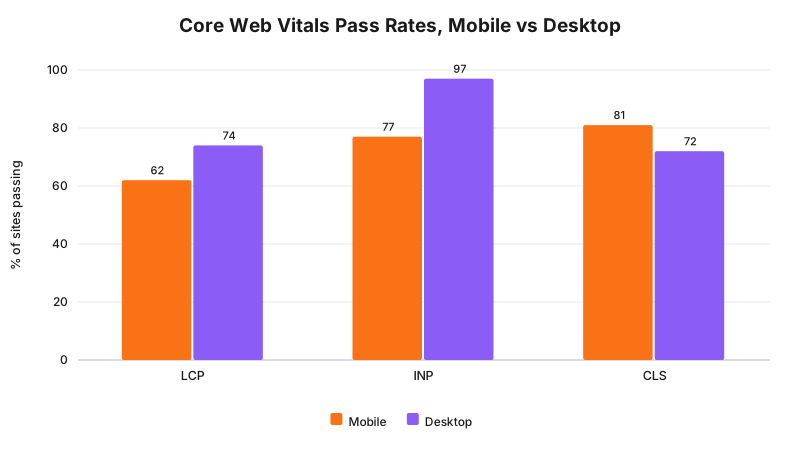
Largest Contentful Paint is the weak point on mobile, and it is also the metric most directly tied to the load-time-versus-conversion data above. If your main content is not visible within about two and a half seconds on a mid-range phone, you are already outside Google’s “good” band before a visitor decides whether to stay.
Takeaway: more than half of mobile websites are still failing the exact speed test their own visitors are silently applying.
Australia’s Networks Are Fast. Most Websites Aren’t.
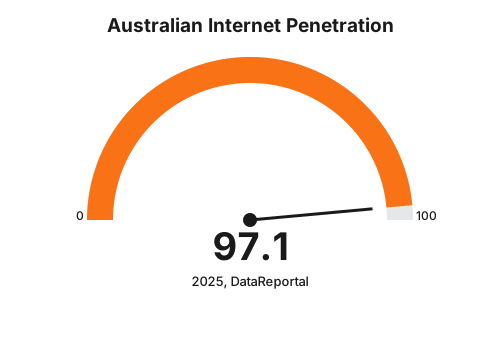
It is tempting to blame the network. DataReportal’s Digital 2026 Australia report, drawing on Ookla speed test data through August 2025, found median mobile download speed in Australia had reached 122.2 Mbps, up 24.9% year over year. Internet penetration sits at 97.1%, with 26.2 million Australians online.
That is a fast, well-connected market by any global measure. A three-second load time on a 122 Mbps connection is not a bandwidth problem. It is a code problem: unoptimised images, render-blocking scripts, uncompressed fonts, or a server that takes too long to respond before the browser can start doing anything at all.
Takeaway: when the network is this fast, a slow website has nowhere left to hide. The bottleneck is what you built, not what your visitor is connecting through.
What to Fix First
Every number above points at the same short list of fixes, roughly in order of impact for most small business sites.
- Compress and correctly size hero images before anything else touches Largest Contentful Paint. This is the single biggest lever in most audits.
- Defer or remove render-blocking JavaScript that runs before the main content paints.
- Reserve space for images and embeds so the layout does not jump once they load, protecting Cumulative Layout Shift.
- Move to a host or CDN that responds fast on the first byte, especially if most of your traffic is mobile.
- Re-test after each change. A single fix rarely moves all three Core Web Vitals at once.
Takeaway: fixing page speed is a short, ordered list, not a redesign, and the data above shows exactly what each step on that list is worth.
RockingWeb builds and audits websites for speed from the first line of code, not as an afterthought bolted on later. See how we approach web design and development for Western Australian businesses, or get in touch for a straight read on where your own site is losing conversions to load time.
Sources
- Google (DoubleClick by Google), “The Need for Mobile Speed,” reported by Marketing Dive. 2016.
- Portent. “Site Speed & Conversion Rate: New Data.” 2022 update, based on a 30-day snapshot across 20 sites.
- Google and Deloitte Digital. “Milliseconds Make Millions.” 2020.
- HTTP Archive. “2025 Web Almanac: Performance.” July 2025 CrUX dataset.
- DataReportal. “Digital 2026: Australia.” Data through October 2025.
Note: the Portent and Deloitte Digital studies draw on global site data, not an Australia-only sample. Where a figure is Australia-specific, this post says so explicitly next to the number.
Vikas Thakur
Founder of RockingWeb. 16 years of experience from working at TPG, iiNet and Monadelphous, now building websites, software and digital marketing for local businesses in Rockingham and Perth.