Client Reporting for Web Agencies Australia 2026
70% of agency leaders say reporting is critical to retention, yet most Australian agencies still email a PDF once a month. Here is what the data says about the gap between what clients get and what they need.
 Vikas Thakur Founder, RockingWeb Updated Jun 28, 2026 9 min read
On this page 12
- Key Takeaways
- In Brief
- What Most Australian Agencies Actually Do
- What Clients Actually Want to See
- The Retention Numbers Are Unambiguous
- The Real Cost of Monthly PDF Reporting
- Real-Time Dashboards: What the Data Shows
- The RockingWeb Approach: A Live Portal, Not a Monthly PDF
- What Reporting Frequency Actually Works
- What to Fix Before Your Next Report Goes Out
- The Difference Between Agencies That Grow and Agencies That Grind
- See the RockingWeb Client Portal
Key Takeaways
- 70% of agency leaders say client reporting is critical to retention, per AgencyAnalytics’ 2025 Benchmarks Report (220+ agency respondents)
- Agencies that align reporting with client business outcomes see 60% higher retention rates (AgencyAnalytics, 2025)
- 43% of agencies report average client lifespans of 2–5 years. Strong reporting is the common denominator
- Retainer clients stay nearly 5 years on average; project clients stay just 2 years (AgencyAnalytics, 2025)
- Agencies running quarterly business reviews achieve 15–20% higher retention than those that do not
- 47% of agencies use Looker Studio for reporting; 23% still rely on Google Sheets and Excel
- Real-time dashboards reduce client meetings by an average of 20 minutes per week per account
- Clients want 5 metrics above all: conversions, email engagement, website traffic, site engagement, and social analytics
In Brief
70% of agency leaders rate reporting as critical to retention, yet most Australian web agencies still send a monthly PDF by email. Clients who can access their data on demand stay longer and churn less.
I have been running digital campaigns for 16 years. And the single biggest source of client churn I have seen is not bad results.
It is bad communication.
A client who gets good results but never understands them will still leave. A client who gets average results but understands what is happening, why it is happening, and what comes next will often stay for years. That gap sits mostly in how you report.
Most Australian web agencies are still stuck in 2015. Monthly PDF. Emailed to a general inbox. Opened by someone who does not know what a CTR is and does not have time to ask. If it gets opened at all.
That model is broken. Here is the data, and here is what to do instead.
What Most Australian Agencies Actually Do
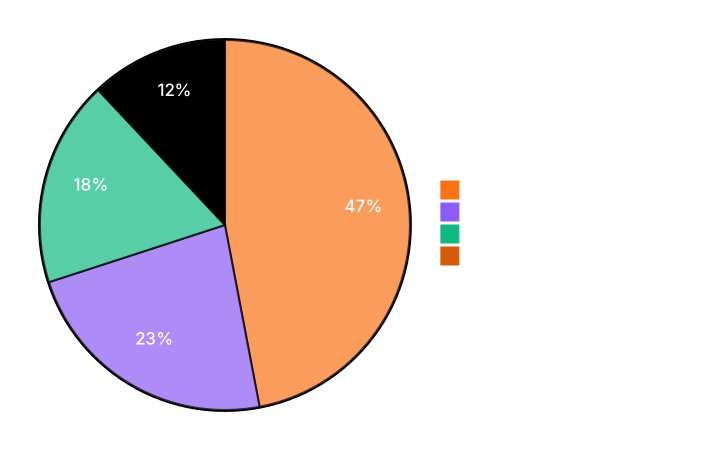
The 2024 Agency Benchmarks Report from AgencyAnalytics, based on 251 marketing agencies across Australia, the US, UK, Canada, and New Zealand, found that Looker Studio is used by 47% of agencies for reporting and visualisation. Another 23% rely on Google Sheets and Excel.
In practice, that means the majority of Australian agencies are compiling data from multiple tools (Google Analytics, Search Console, Meta Ads, Google Ads) and pasting it into a document or slide deck once a month.
The process takes hours. The result is a static snapshot of a 30-day window. By the time the client reads it, the data is already a month old.
That is not reporting. That is archaeology.
The problem gets worse when you consider what the report is trying to do. A monthly PDF has to explain context, justify spend, highlight wins, acknowledge problems, and set expectations for the next month. All without the client being able to ask a follow-up question. It is a one-way broadcast to someone who may not speak the language.
Most clients do not say they do not understand the report. They just stop engaging with it. Then they stop engaging with you.
What Clients Actually Want to See
The Content Marketing Institute’s 2024 research found that the five metrics clients prioritise above all others are:
| Priority | Metric |
|---|---|
| 1 | Conversions (leads, sales, enquiries) |
| 2 | Email engagement (opens, clicks) |
| 3 | Website traffic |
| 4 | Website engagement (time on site, pages viewed) |
| 5 | Social media analytics |
Notice what is not on that list: impressions, reach, domain authority, keyword positions (at least not as primary metrics), technical SEO scores.
Clients want to know whether the money they are spending is generating business results. They do not care about the machinery. They care about the output.
The average agency report leads with the machinery. Rankings, crawl errors, CTR by query, Quality Score. The client’s eye glazes over by page three. They skip to the summary. The summary says “results were positive this month.” They close the PDF.
A TechRound 2025 analysis of client reporting preferences found that executives need to extract conclusions in 15 minutes, not 2 hours. If your report requires more than 15 minutes to interpret, you have already lost them.
The Retention Numbers Are Unambiguous
Reporting quality has a direct line to how long clients stay.
According to AgencyAnalytics’ 2025 Marketing Agency Benchmarks Report, agencies that align their reporting with client business objectives see 60% higher retention rates than those that do not. That is not a marginal improvement. That is the difference between a client base that compounds and one that churns.
The same research found that agencies running Quarterly Business Reviews (QBRs) achieve 15–20% higher retention rates. QBRs work because they force a structured conversation about results in relation to business goals, not just marketing metrics.
The client lifespan data tells the same story. Retainer-based agencies retain clients for an average of 56 months (nearly 5 years). Project-based agencies average just 24 months. The reporting cadence is a major driver of that gap.
And for agencies wondering whether size matters: agencies with 51+ employees maintain 15% annual churn, compared to 32% for agencies with 1–10 employees. Part of that gap is process. Larger agencies have standardised reporting. Smaller agencies often improvise it every month.
The Real Cost of Monthly PDF Reporting
Let me be direct about what monthly PDF reporting costs you.
Time, first. Pulling data from four or five platforms, formatting it, writing commentary, chasing client feedback. Most agencies spend 3–6 hours per client per month on reporting. At 10 clients, that is up to 60 hours. That is one full week of productive capacity, gone, every month.
Then there is the relationship cost. When a client wants to know how their campaign performed last Tuesday, you cannot tell them until the next report. When they want to compare this month to three months ago, they have to dig through three PDFs. Every unanswered question is a small erosion of trust.
And the churn cost. If monthly PDF reporting contributes to a 32% annual churn rate (the average for small agencies), and your average client is worth AU$2,000/month, losing 3 clients from a 10-client roster costs you AU$72,000 in annual recurring revenue. That is not a reporting problem. That is a revenue problem.
Real-Time Dashboards: What the Data Shows
The shift from monthly PDFs to always-on client dashboards is not new. But adoption among smaller Australian agencies remains low.
A 2025 Swydo analysis of agency reporting tools found that dashboards reduce client meetings by an average of 20 minutes per week per account. Clients who can answer their own questions (“how many leads did we get this week?”) do not need to call you to ask.
The same research notes that agencies typically see full ROI on reporting automation within 30–60 days through time savings alone. The additional benefit is harder to quantify but real: clients who check their dashboard regularly are more engaged, more informed, and more likely to approve additional spend when results are good.
There is an important nuance here. A 2025 analysis from Layer Five found that clients want trustworthy dashboards more than real-time ones. Data accuracy matters more than data speed. If your dashboard pulls from inconsistent sources or shows numbers that do not match what the client sees in their own Google Analytics, you create more confusion, not less.
The technology is not the point. The point is transparency.
The RockingWeb Approach: A Live Portal, Not a Monthly PDF
Most web agencies email you a PDF report once a month.
At RockingWeb, our clients get a live portal at dash.rockingweb.com.au that is accessible any time. Here is what that means in practice:
| Feature | Monthly PDF Model | RockingWeb Client Portal |
|---|---|---|
| Data freshness | 30 days old | Updated regularly |
| Access | Email attachment | Browser login, any device |
| Invoices | Separate system or email | Managed inside the portal |
| Support tickets | Email or phone | Logged and tracked in portal |
| Historical data | Requires searching old emails | Always visible in one place |
| Client questions answered | Next month’s report | On demand |
The portal is not a gimmick. It is what transparent agency-client relationships look like when they are built properly.
Clients who can see their results on their own terms ask better questions, grasp the value of the work faster, and make quicker decisions when we recommend a strategy change. They also stay longer. That is not a theory. It is what we see in our own retention numbers.
What Reporting Frequency Actually Works
The AgencyAnalytics 2025 Benchmarks Report surveyed over 220 agency leaders and found no single “correct” reporting frequency. What matters is alignment with client expectations.
That said, a practical framework for Australian web agencies:
| Client Type | Recommended Cadence |
|---|---|
| SEO retainer | Monthly report + live dashboard |
| Paid ads (active spend) | Weekly snapshot + monthly deep-dive |
| Web maintenance retainer | Monthly summary |
| Full-service retainer | Monthly report + QBR every quarter |
The QBR (Quarterly Business Review) is worth calling out separately. It is a 60-minute structured conversation that ties campaign performance to business outcomes. Agencies that run QBRs achieve 15–20% higher retention, per AgencyAnalytics’ research. Most small agencies never do them. That is a missed opportunity sitting in plain sight.
What to Fix Before Your Next Report Goes Out
If you are still sending monthly PDFs, here is a practical starting point:
Start with the client’s goal, not your metrics. Every report should open with a one-paragraph reminder of what the client is trying to achieve (more leads, lower cost per acquisition, more foot traffic) and how the current numbers relate to that goal.
Cut vanity metrics ruthlessly. Impressions, reach, and page views are context, not results. If a metric does not connect to revenue or lead generation, it belongs in an appendix.
Add a “What we did / What happened / What’s next” section. Three paragraphs. No jargon. This is what clients read.
Automate data collection. Looker Studio, AgencyAnalytics, or similar tools eliminate the manual data-pulling phase. That time goes back into strategy and creative.
Consider a live dashboard. Even a read-only Looker Studio dashboard that clients can access between reports reduces inbound queries and improves perceived transparency.
The Difference Between Agencies That Grow and Agencies That Grind
Agencies with strong reporting retention are not just better at marketing. They are easier to do business with.
Clients stay where they feel informed. They leave where they feel confused. A monthly PDF optimised for the agency’s convenience is not reporting. It is documentation that happens to get emailed to the client once a month.
The agencies growing fastest in Australia right now share a common trait: their clients know exactly what they are getting, why it matters, and what is coming next. That clarity is not accidental. It is built into the process.
See the RockingWeb Client Portal
We built the portal because we got tired of explaining the same numbers in a different PDF every month.
Now our clients log in, check their results, raise a ticket if something needs attention, and manage their invoices. All in one place. It changed how we work. It changed how long clients stay.
If you want to see it in action, book a 15-minute demo at rockingweb.com.au/contact/. We will show you what a transparent agency relationship looks like.
Vikas Thakur
Founder of RockingWeb. 16 years building for companies like TPG, iiNet and Monadelphous, now focused on websites and marketing that comply with AHPRA's advertising guidelines and still book patients.