

How Many Dentists Are in Australia? Workforce Data
Australia had approximately 20,300 registered dentists in 2023, a rate of 61.1 FTE dentists per 100,000 people, according to AIHW's National Health Workforce Dataset. Full state and registrant-type breakdown.
 Vikas Thakur 8 min read
On this page 6
- How Many Dentists Does Australia Actually Have?
- Where Australia’s Dentists Are Actually Registered
- What Type of Dental Practitioner Is Actually Registered
- Where Australia’s Dentists Actually Work
- Why This Workforce Data Matters for Practice Compliance
- Getting Compliance Right Before Competing on This Data
Key Takeaways
- Australia had approximately 20,300 registered dentists in 2023, according to AIHW’s National Health Workforce Dataset
- That works out to 61.1 FTE dentists per 100,000 population in 2023, down slightly from 62.0 in 2022
- The Dental Board of Australia’s own registrant data counted 21,308 people holding a “Dentist” registration as of 31 December 2024, and 28,677 dental practitioners in total across all five registration types
- NSW carries the largest dentist headcount at 6,324, close to a third of the national total, per the Dental Board’s December 2024 data
- The ACT has the highest dentist-to-population rate at 68.7 per 100,000, while the Northern Territory has the lowest at 34.2
- Major cities have more than triple the dentist density of remote Australia: 68.3 per 100,000 versus 21.4 in remote and very remote areas
- Dentists make up 74.3% of all registered dental practitioners, with oral health therapists, hygienists and prosthetists making up the remainder
- Close to 9 in 10 registered dental practitioners were actually employed in the field in 2023
Australia had approximately 20,300 registered dentists in 2023, a rate of 61.1 FTE dentists for every 100,000 people, according to the Australian Institute of Health and Welfare’s National Health Workforce Dataset. Separately, the Dental Board of Australia’s own registrant data, the regulator that issues every dental registration in the country, counted 21,308 people holding a “Dentist” registration as of 31 December 2024, and 28,677 dental practitioners in total once hygienists, therapists, prosthetists and oral health therapists are added in.
Two different counts. Two different purposes. Both matter if you’re trying to work out how crowded, or how thin, the dental market actually is in a given state.
The gap between capital cities and the bush is even starker than the national average suggests. Major cities carry more than three times the dentist density of remote Australia.
This post breaks down exactly where Australia’s dentists are registered, what type of practitioner they are, and what the workforce data means for a practice competing in this market.
How Many Dentists Does Australia Actually Have?
| Measure | Figure | Year | Source |
|---|---|---|---|
| Registered dentists (national estimate) | ~20,300 | 2023 | AIHW, National Health Workforce Dataset |
| FTE dentists per 100,000 population | 61.1 | 2023 | AIHW, National Health Workforce Dataset |
| People holding a “Dentist” registration | 21,308 | Dec 2024 | Dental Board of Australia registrant data |
| Total dental practitioners, all registration types | 28,677 | Dec 2024 | Dental Board of Australia registrant data |
These two counts aren’t the same measurement. The AIHW figure is a survey-based, full-time-equivalent workforce estimate for 2023. The Dental Board figure is the raw count of everyone holding an active registration as of the December 2024 quarter, including part-time and non-practising registrants. Both are legitimate, they just answer slightly different questions.
Ten years earlier, in 2014, that AIHW estimate sat at around 15,800 registered dentists. Australia has added roughly 4,500 dentists to its workforce over that decade, while the national FTE rate actually dipped slightly, from 62.0 per 100,000 in 2022 to 61.1 in 2023. Population growth is outpacing dentist supply growth, even as the raw headcount climbs.
Takeaway: the workforce is growing in absolute numbers, but not fast enough to keep the per-capita rate rising. That’s the number that actually determines how easy it is for a patient to get an appointment.
Where Australia’s Dentists Are Actually Registered
The Dental Board of Australia’s quarterly registrant data breaks the “Dentist” registration division down by state and territory. As of 31 December 2024, NSW held the largest share by a wide margin.
| State/territory | Registered dentists (Dec 2024) |
|---|---|
| New South Wales | 6,324 |
| Victoria | 5,219 |
| Queensland | 4,479 |
| Western Australia | 2,309 |
| South Australia | 1,414 |
| ACT, Tasmania & NT combined | 836 |
Excludes 727 dentists with no principal place of practice recorded. Source: Dental Board of Australia, Registrant Data, reporting period 1 October to 31 December 2024.
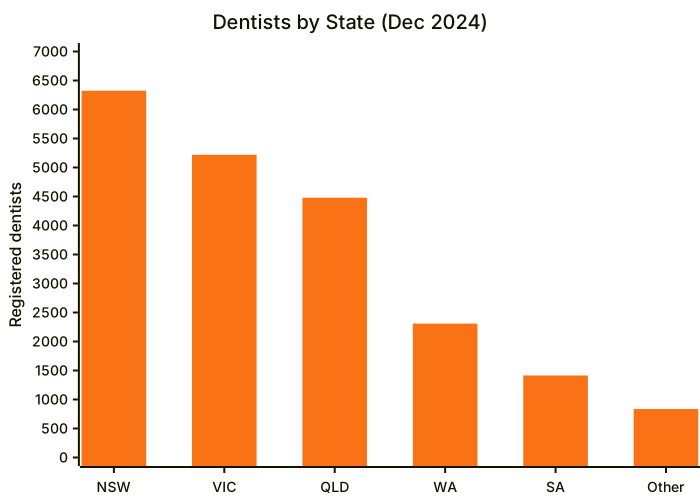
Headcount doesn’t tell the density story on its own though. When AIHW converts these figures to a per-capita rate, the ranking flips in places. The ACT has the highest dentist-to-population rate in the country at 68.7 per 100,000, despite having the smallest raw headcount of any jurisdiction bar the NT and Tasmania. The Northern Territory sits at the opposite end, with just 34.2 dentists per 100,000 people, roughly half the ACT’s rate.
Remoteness matters more than any single state boundary. Major cities average 68.3 dentists per 100,000 residents. Remote and very remote areas average 21.4, less than a third of the capital-city rate. A patient in outer regional or remote Australia is dealing with a fundamentally thinner market than someone in Canberra or inner Sydney, regardless of which state they’re in.
Takeaway: a practice’s local competition looks completely different depending on whether “local” means a capital city postcode or a regional one, and the state-level averages hide that gap.
What Type of Dental Practitioner Is Actually Registered
“Dentist” is only one of five registration types the Dental Board of Australia oversees. Dental hygienists, dental therapists, dental prosthetists and oral health therapists are all separately registered, and together they make up over a quarter of the profession.
| Registration type | Count (Dec 2024) | Share of total |
|---|---|---|
| Dentist | 21,308 | 74.3% |
| Oral health therapist | 3,325 | 11.6% |
| Dental hygienist | 1,513 | 5.3% |
| Dental prosthetist | 1,325 | 4.6% |
| Dental therapist / dual-registered | 1,206 | 4.2% |
Source: Dental Board of Australia, Registrant Data, reporting period 1 October to 31 December 2024. Total across all types: 28,677.
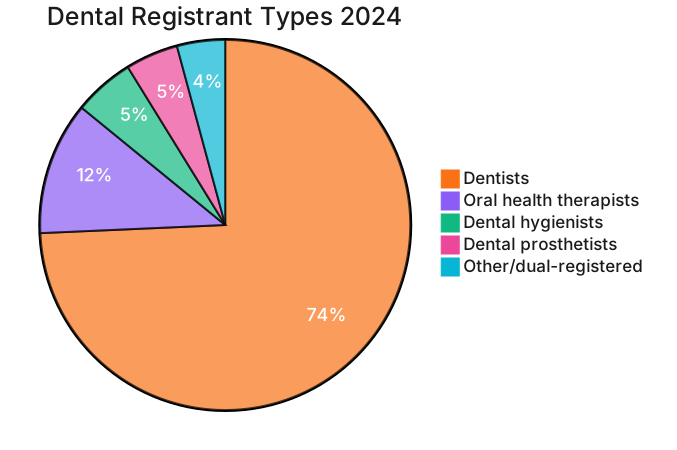
The same registrant data shows the profession is majority female nationally, at 56.6% of all registered dental practitioners against 43.4% male, a gap that’s widened steadily over the past decade as more women enter dental training programs. Age distribution skews younger too: the single largest age bracket is 30 to 34 year olds, at 4,533 practitioners, followed closely by 35 to 39 year olds at 4,500.
Takeaway: “how many dentists” undercounts the workforce by roughly a quarter if hygienists, therapists and prosthetists aren’t counted alongside them, and any market-sizing exercise needs to be explicit about which of the five registration types it’s measuring.
Where Australia’s Dentists Actually Work
AIHW’s 2023 data also breaks down employment setting for the registered dentist workforce. Close to 9 in 10 registered dental practitioners were employed in their field that year, and most of them weren’t solo operators.
| Employment setting | Approx. dentists (2023) |
|---|---|
| Group private practice | ~10,000 |
| Solo private practice | ~4,900 |
| Public dental clinic | ~800 (4.6% of employed dentists) |
Source: AIHW, Oral health and dental care in Australia, dental workforce chapter, National Health Workforce Dataset (2023 data, published 2025).
Group practices now employ roughly twice as many dentists as solo practices, a structural shift that matters for anyone marketing to the sector. The buyer isn’t a single principal dentist making every decision anymore; in most cases it’s a group practice with multiple decision-makers, shared branding across locations, and compliance obligations that scale with every additional chair.
Takeaway: group practice consolidation means a compliance issue on one clinic’s website can be a group-wide exposure across every location that shares the brand.
Why This Workforce Data Matters for Practice Compliance
A growing, unevenly distributed workforce means more competition for patients in some postcodes and thinner competition in others, but every one of those 21,308 registered dentists is regulated under the same AHPRA National Law regardless of location. Our full breakdown of AHPRA’s advertising rules for cosmetic dentistry covers what changed under the September 2025 amendments, including the testimonial ban and the narrower before-and-after imagery exemptions that apply to every dentist’s website, not just the large group practices.
That applies whether a practice is one of NSW’s 6,324 registered dentists competing in a dense market, or one of the NT’s much smaller pool competing in a thinner one. The advertising rules don’t scale down for a smaller market.
Takeaway: workforce density changes how much competition a practice faces. It doesn’t change what a practice is allowed to say about itself online.
Getting Compliance Right Before Competing on This Data
Most practices don’t know which parts of their current website would fail an AHPRA review until someone checks it line by line. If your site hasn’t been reviewed since the September 2025 amendments landed, RockingWeb’s free AHPRA website compliance audit flags exactly what needs to change before a patient complaint does it for you.
RockingWeb is an AHPRA-compliance specialist for Australian cosmetic clinics and dental practices, not a generalist agency bolting on compliance as an afterthought. Every cosmetic clinic and dental website we build starts from the current advertising guidelines, whether the practice is one of six chairs in Sydney or the only dentist in a regional town.
For practices that want the audit, the compliant rebuild, and ongoing compliant ad management handled as one service, ClinicPipeline is our audit-and-ads offering built specifically for regulated dental and cosmetic clinics.
Takeaway: the audit is the cheapest insurance a practice can buy against the compliance side of operating in this workforce, in any state, at any density.
Data sources: Australian Institute of Health and Welfare, Oral health and dental care in Australia, dental workforce chapter, National Health Workforce Dataset (2023 data); Dental Board of Australia, Registrant Data, reporting period 1 October to 31 December 2024, published via Ahpra; Australian Bureau of Statistics, National, state and territory population, March 2023.
RockingWeb builds AHPRA-compliant websites for Australian cosmetic clinics and dental practices. Get a free compliance audit or contact us to discuss a compliant rebuild.
Vikas Thakur
Founder of RockingWeb. 16 years building for companies like TPG, iiNet and Monadelphous, now focused on websites and marketing that comply with AHPRA's advertising guidelines and still book patients.
![Dentures Cost Australia: Full vs Partial Price Data [2026]](/assets/ahpra-social-media-rules-cosmetic-clinics-LFCez6qC.png)
![Wisdom Teeth Removal Cost Australia: $491 vs $4,500 [2026]](/assets/cosmetic-clinic-seo-australia-DWhO816X.png)
![Invisalign vs Braces Cost Australia: Price Data [2026 Guide]](/assets/ahpra-treatment-naming-website-B-vXh4ba.png)
![All-on-4 Cost Australia: Full-Arch Price Guide [2026 Data]](/assets/cosmetic-clinic-website-design-australia-OcS5cxtN.png)