

Anti-Wrinkle Injection Statistics Australia [2026 Data]
Australia's facial injectable market was worth USD 3.1 billion in 2024, according to Grand View Research. We checked the common claim that Australia leads the world per capita on anti-wrinkle injectables, and the primary data doesn't back it up.
 Vikas Thakur Founder, RockingWeb 9 min read
Key Takeaways
- Australia’s facial injectable market was worth USD 3.1 billion in 2024, forecast to reach USD 9.08 billion by 2030, a 19.3% CAGR, according to Grand View Research
- Botulinum toxin type A (Botox, Dysport, Xeomin, Nuceiva) made up 36.36% of that Australian market in 2023, its single largest product segment
- Globally, botulinum toxin was the most-performed non-surgical procedure in 2024 at 7.8 million procedures, according to ISAPS’s 2024 Global Survey
- 47.0% of botulinum toxin patients worldwide are aged 35-50, more than any other age bracket, per the same ISAPS survey
- Women account for 85.5% of cosmetic procedure patients globally, men the remaining 14.5%, ISAPS 2024
- The US recorded 4,715,716 botulinum toxin type A procedures in 2023, up 6% on 2022, according to the American Society of Plastic Surgeons (ASPS)
- The UK’s facial injectable market sits at USD 451.5 million (2024), a fraction of Australia’s, though the UK’s population is more than double
- We could not verify the widely repeated claim that Australia ranks among the highest per-capita anti-wrinkle injectable users in the world against any current primary source, and we’re not going to repeat it as fact
Australia’s facial injectable market was worth USD 3.1 billion in 2024, on track for USD 9.08 billion by 2030, according to Grand View Research. Botulinum toxin, sold here as Botox, Dysport, Xeomin, and Nuceiva, accounts for more than a third of that spend. You’ve probably also seen the claim that Australia has one of the highest rates of anti-wrinkle injectable use per person in the world. We went looking for the source. It isn’t there, at least not in any current, country-specific dataset we could find. Here’s what we could verify, and where the widely shared “per capita” claim actually breaks down.
Checking the Per-Capita Claim
Search “Australia botox per capita” and you’ll find dozens of clinic blogs and directories repeating some version of the same line: Australia is one of the highest per-capita users of anti-wrinkle injectables on earth. We wanted the primary source behind that. ISAPS, the International Society of Aesthetic Plastic Surgery, is the closest thing the industry has to an independent global tracker, and its annual Global Survey is the dataset every credible comparison should trace back to.
Here’s the problem: ISAPS’s 2024 Global Survey (and its 2023 edition) report absolute procedure counts by country, and separately, procedure-type totals worldwide. It doesn’t cross the two together and publish a per-country, per-capita rate for botulinum toxin specifically. The most recent per-capita, all-procedure figure we could confirm traces back to ISAPS’s earlier survey years, and even that measured total cosmetic procedures (surgical and non-surgical combined), not anti-wrinkle injectables on their own.
| What gets claimed | What we could verify |
|---|---|
| ”Australia ranks #X in the world for anti-wrinkle injectables per capita” | No current, country-specific primary source found for this exact claim |
| ”ISAPS ranks countries by botulinum toxin use per person” | ISAPS publishes country totals and global procedure-type totals separately, not combined |
| Australia’s raw 2024 botulinum toxin volume (board-certified surgeons only) | 26,775 cases, already covered in our companion post on how many cosmetic procedures Australia performs yearly |
If you’re sizing the Australian market or briefing a client, the honest answer is that a clean, apples-to-apples international per-capita ranking for anti-wrinkle injectables specifically doesn’t exist in the public data. What does exist is market-size data, procedure volume by country, and age and gender breakdowns, all covered below with the actual source named.
Takeaway: a claim repeated often enough starts to sound like a fact. This one doesn’t hold up against the primary source it’s supposedly based on, and we’d rather tell you that than repeat it.
What Australians Actually Spend on Anti-Wrinkle Injectables
Where the data does hold up is market value. Grand View Research put Australia’s facial injectable market at USD 2.7 billion in 2023, climbing to an estimated USD 3.1 billion in 2024, and forecasts USD 9.08 billion by 2030, a 19.3% compound annual growth rate. Botulinum toxin type A was the single largest product category inside that market, holding a 36.36% share in 2023, ahead of hyaluronic acid fillers and every other injectable type.
Compare that to the UK, a market of a similar developed-economy structure but more than double Australia’s population. Grand View Research valued the UK’s facial injectable market at USD 451.5 million in 2024, forecasting USD 829.7 million by 2030 at a 10.8% CAGR. Botulinum toxin type A held an even larger share of that market, 55.08% in 2024.
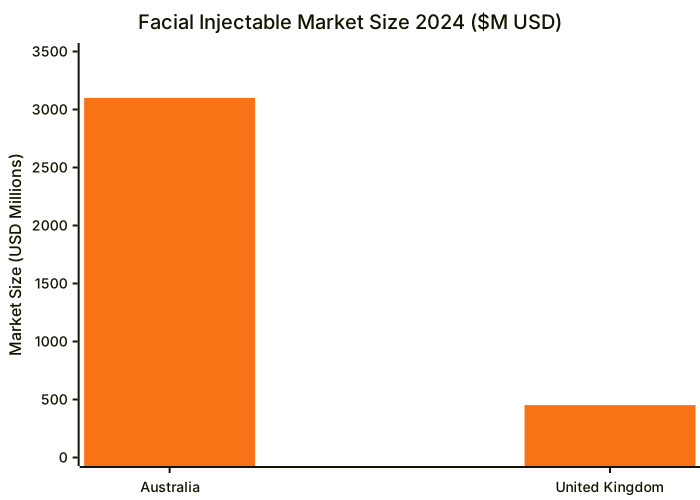
Both figures come from the same research house using a comparable product taxonomy (botulinum toxin type A, hyaluronic acid, collagen, calcium hydroxylapatite, and polymer fillers), which makes this the most defensible market-size comparison we could build, far more so than the unsourced per-capita claim above. We didn’t try to convert these into a per-person spend figure ourselves. Each country report uses its own base-year assumptions, and dividing mismatched market sizing methodologies by population would produce exactly the kind of shaky statistic we’re trying to avoid here.
The global facial injectable market, for context, was worth USD 12.53 billion in 2024, heading toward USD 24.9 billion by 2030 at a 12.3% CAGR, per the same source.
Takeaway: Australia’s injectable market is growing nearly twice as fast as the UK’s, and botulinum toxin remains the single biggest line item in both, even if a clean per-capita ranking between the two isn’t something the public data supports.
Who’s Actually Getting Anti-Wrinkle Injections
ISAPS’s 2024 Global Survey does break patients down by age and gender, globally. Of the 7.8 million botulinum toxin procedures its member surgeons recorded worldwide in 2024, the 35-50 age bracket accounted for 47.0% of the total, more than double the next closest group.
| Age group | Share of global botulinum toxin procedures (2024) |
|---|---|
| 35-50 years | 47.0% |
| 51-64 years | 23.6% |
| 18-34 years | 22.8% |
| 65+ years | 6.5% |
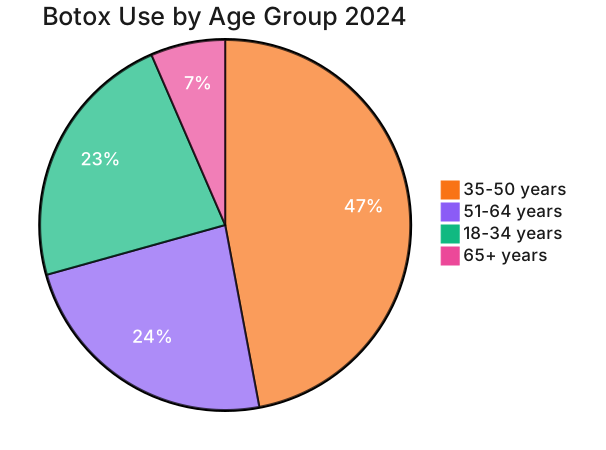
That 35-50 concentration lines up with the broader Australian cosmetic procedure demand data we’ve covered in our cosmetic surgery statistics piece, where the same age bracket leads overall demand. On gender, ISAPS’s 2024 figures show women made up 85.5% of cosmetic procedure patients worldwide (across all procedure types, surgical and non-surgical combined), with men the remaining 14.5%.
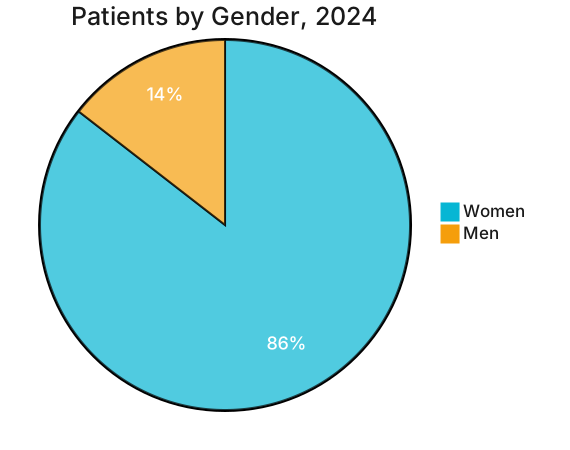
ISAPS doesn’t publish a gender split isolated to botulinum toxin alone, only across all procedures its members reported, so treat that figure as directional for injectables rather than injectable-specific. We didn’t find an Australia-only age or gender breakdown for anti-wrinkle injectables specifically from AHPRA, the TGA, or an Australian professional body. What’s publicly available is global, and we’ve labelled it that way rather than badging global data as an Australian statistic.
Takeaway: globally, the middle-aged, mostly-female patient is still the core anti-wrinkle injectable customer, though the fastest-growing segment in most clinic-side reporting is younger patients booking “preventative” treatments earlier.
Product and Dosing Statistics
Four botulinum toxin type A brands are approved for use in Australia: Botox, Dysport, Xeomin, and Nuceiva. Botox, Xeomin, and Nuceiva use comparable unit dosing (roughly 1:1), while Dysport requires 2.5 to 3 times more units to achieve an equivalent clinical effect, according to product prescribing information and clinic-published dosing guides. Units aren’t interchangeable across brands, a distinction every compliant clinic website needs to get right when publishing pricing.
Standard dosing for the three most commonly treated areas, drawn from the approved Botox Cosmetic prescribing information used as the clinical reference across the industry:
| Treatment area | Standard dose (Units) | Injection sites |
|---|---|---|
| Glabellar lines (frown lines) | 20 Units | 5 sites (2 per corrugator muscle, 1 procerus) |
| Forehead lines | 20 Units | Multiple sites across frontalis muscle |
| Lateral canthal lines (crow’s feet) | 24 Units (12 per side) | 3 sites per side, 6 total |
| Combined treatment (all three areas) | 64 Units | 14 injection points total |
That 64-unit combined dose is the reference figure clinics use to model per-patient product cost, and it’s a useful sanity check against supplier invoices when a patient’s treatment plan doesn’t match what’s actually billed.
Takeaway: dosing is standardised at the product level, but brand choice changes the unit count and the price, which is exactly the kind of detail patients researching a clinic online are trying to compare before they book.
What This Means for Clinics Marketing Anti-Wrinkle Treatments
None of this changes the core compliance picture. AHPRA’s advertising guidelines still ban testimonials, before-and-after photography, and Schedule 4 medicine brand names like Botox and Dysport from public-facing marketing, regardless of how big the injectables market gets or how it compares internationally. A growing, high-value category with strict advertising rules is exactly the environment where an unverified stat, a banned brand mention, or an old testimonial sitting on a website can turn into a real compliance problem, not just a marketing one.
If you’re not sure where your site stands, get in touch with RockingWeb and we’ll check it against the current rules and tell you exactly what to fix. For clinics building or rebuilding a site around this category, we design AHPRA and TGA-compliant cosmetic clinic websites from the first wireframe, and ClinicPipeline runs the ongoing marketing engine behind it, built for a market growing at close to 20% a year without leaning on the claims that get clinics in trouble.
Takeaway: the injectables market is growing fast enough that the clinics winning share are the ones who can market compliantly and accurately, not the ones repeating the biggest-sounding stat they found online.
Data sources: International Society of Aesthetic Plastic Surgery (ISAPS), 2024 Global Survey on Aesthetic/Cosmetic Procedures; Grand View Research, Australia Facial Injectable Market Report and UK Facial Injectable Market Report (2024); American Society of Plastic Surgeons (ASPS), 2023 Plastic Surgery Statistics Report; Botox Cosmetic full prescribing information.
RockingWeb builds AHPRA-compliant websites for Australian cosmetic clinics. Visit rockingweb.com.au to see our work, or get in touch to discuss your clinic’s website and marketing.
Vikas Thakur
Founder of RockingWeb. 16 years building for companies like TPG, iiNet and Monadelphous, now focused on websites and marketing that comply with AHPRA's advertising guidelines and still book patients.

![7 Million Aussies Want Cosmetic Surgery: Demand Data [2026]](/assets/medical-skincare-clinic-marketing-australia-DbG0v4jA.png)

![How Many Cosmetic Procedures Australia Performs Yearly [2026]](/assets/cosmetic-clinic-patient-retention-CmO369h2.png)